Quality & Regulatory Solutions for PAT in Continuous Manufacturing

Process analytical technology (PAT) is perceived as the main enabler for a robust control strategy with continuous manufacturing (CM) because process analytical technology can aid in implementing continuous manufacturing throughout the entire life cycle. This article discusses quality and regulatory hurdles in the life cycle of a process analytical technology application—including model life-cycle management—in combination with continuous manufacturing for small and large molecules, with the goal of proposing strategies to resolve each challenge.
Continuous manufacturing represents the next generation of pharmaceutical manufacturing processes for both large and small molecules. It is recognized by regulatory authorities as a key emerging technology. The US FDA has approved various small molecule products and recently issued draft guidance for industry on continuous manufacturing.1, 2 In this article, we do not focus on the capabilities of specific process analytical technology technologies, which have been reviewed in other recent publications.3, 4, 5,6 Instead, we address how companies can add flexibility and maximize the value of process analytical technology for continuous manufacturing. As we discuss general issues, we focus on how they apply to all or most process analytical technology tools and we use some common process analytical technology tools as aids to describe example scenarios.
Important regulatory guidance on process analytical technology includes ICH Q8 (R2)7 and the FDA’s “Guidance for Industry” from 2004.8 The FDA process analytical technology guidance considers process analytical technology to be,
A system for designing, analyzing, and controlling manufacturing through timely measurements (i.e., during processing) of critical quality and performance attributes of raw and in-process materials and processes, with the goal of ensuring final product quality. It is important to note that the term analytical in process analytical technology is viewed broadly to include chemical, physical, microbiological, mathematical, and risk analysis conducted in an integrated manner.”
For continuous manufacturing, analytics must move closer to the process. Process analytical technology can therefore add significant value in design, analysis, and control of the continuous manufacturing process. Because process analytical technology does not involve pooling or holding of the process, decisions can be made in real time. For example, when designing equipment or modeling unit oper-ation behavior, process analytical technology measurements used to determine residence time distribution (RTD) are critical. During process development, process analytical technology may be used to confirm satisfactory process operation, verify models, inform on divert to waste (DTW) situations, or perform feedback control. The control strategy for a continuous process may also benefit from the use of process analytical technology. Furthermore, process analytical technology can be used for final critical quality attribute (CQA) determination directly or as input to a more complex model that includes process parameters and material attributes.
When developing and implementing a commercial continuous manufacturing line, process analytical technology is recommended, even more strongly than it is for batch manufacturing, for all three phases (design, analysis, and control). However, the extent of process analytical technology use is company- and product-dependent, reflecting the perceived return on investment.
On the continuum from simplest to most complex applications, the optimum level of process analytical technology deployment in various stages of the continuous manufacturing life cycle, from de-sign to routine operation, is a company decision that may be based on perceived risks associated with regulatory and quality considerations. The validation of process analytical technology applications must evolve during their life cycle to ensure they remain fit for purpose. Lack of clarity on regulatory expectations at different points in the life cycle can derail process analytical technology early in the process.
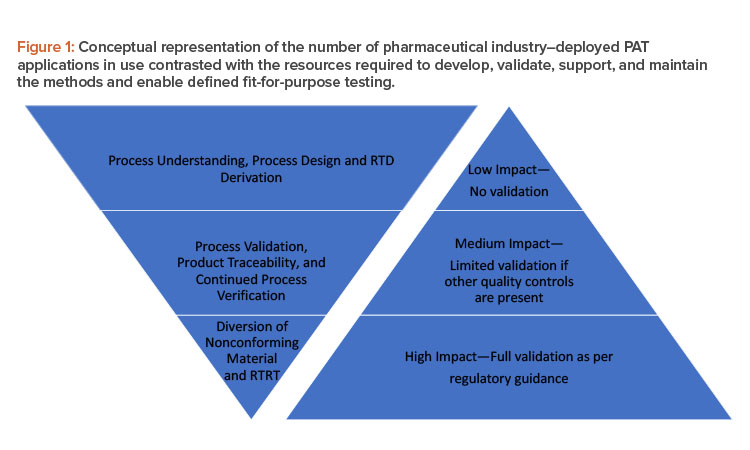
Figure 1 shows how the number of process analytical technology applications tends to decline as we move from process understanding to real-time release testing (RTRT) (left triangle), whereas validation requirements (right triangle) increase as we move from low-impact to high-impact applications. Because successful implementation ofprocess analytical technology can add benefits to a continuous manufacturing process, we suggest in this article ways to increase the utilization of process analytical technology within all stages of the left triangle.
PAT in Development
During early process development, having the tools in place for rapid analysis and visualization helps turn process analytical technology data into immediately actionable knowledge. At this stage, companies often seek to enhance understanding to effectively implement a continuous manufacturing platform, and it might be easy to install a preliminary process analytical technology system for this purpose. Notably, these early data could form the basis of differentiation between good and bad product that determines quality decisions. For this reason, a close-to-GMP-ready system to manage the process analytical technology may be needed earlier in the development process than would be required for a batch process; also, a plan on how to leverage the preliminary system may be required if a permanent system is needed for commercial use. However, in most scenarios, companies do not need to install a commercial release–ready GMP system for initial process development.
Data capture with a process analytical technology system should meet process-specific criteria that are based on the targeted critical quality attributes according to quality by design (QbD) principles. A potential strategy would be to start by using process analytical technology tools, such as semiquantitative or fingerprint methods, to detect relative changes.9 These are easier methods to qualify or validate, which would then allow organizations to use process analytical technology data for quality decisions and help companies leverage the data for future, more advanced controls or decisions. This approach could also streamline the requirements around robustness and system suitability, which may require significant resources in early development. It would be beneficial if a company established a process for qualified versus validated methods similar to what has been done for traditional testing.
To clarify the relationship between residence time distribution and process analytical technology, the FDA published the initial process analytical technology framework,8 which supports the move from static batch processing to more-dynamic approaches that mitigate the risk of producing poor-quality product. ICH implemented a trio of quality guidance: Q8(R2), Q9, and Q10.7, 10, 11 Continuous systems with automation and process control frequently result in high-quality (low-variability) products, whereas traditional batch processing can be less understood, resulting in less-predictable product quality.12
Using high-frequency process analytical technology sensors can ensure adequate sensing to determine the approximate residence time distribution shape. Aided by a simple peak detection algo-rithm, analysts can easily detect the most significant spikes. It is logical to assume that detecting the downstream response is easier than detecting the pulse disturbance itself. If a plug flow process were expected, the perturbation would be largely unchanged as it traveled along the system, meaning pulse into the system would result in a pulse response, although this would be difficult to detect without a very rapid measurement. Residence time distribution plays an im-portant role in material traceability because it characterizes the spreading of the materials through the system. Thus, a disturbance could be predictively tracked through the entire continuous system, enabling downstream control or even removal of the affected material.
The determination of residence time distributions is one of the primary areas in which process analytical technology is used in development. Residence time distribution aids in the traceability of raw materials in the manufacturing process, which is critical when material is continuously fed into and removed from a process. Once the residence time distribution has been determined for each unit operation, as well as the integrated line, it can be used to facilitate material traceability and help determine sensor placement and measurement frequency to ensure that any unacceptable material variations can be detected, recorded, and addressed.
Automation and RTD
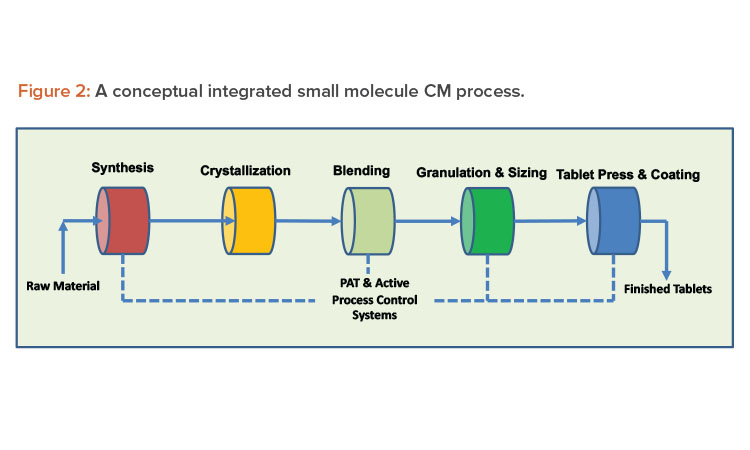
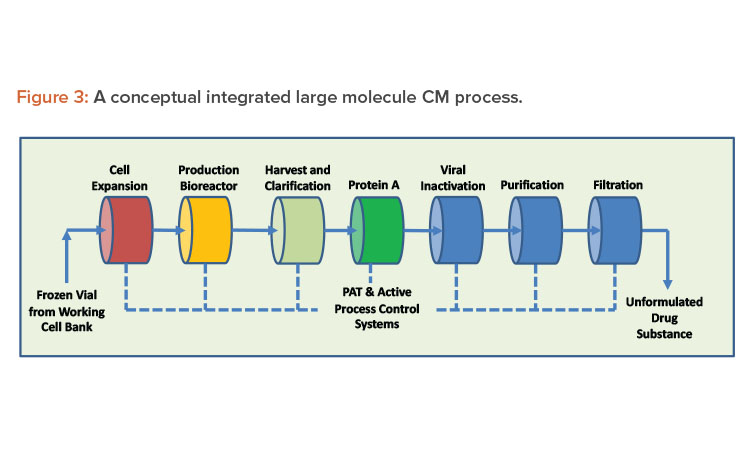
Continuous systems with automation and process control result in high-quality, low-variability products. A properly designed continuous system with appropriate sensors to record and display process parameters, such as critical process parameters (CPPs) and non-critical process parameters, handles small portions of material at any given moment, increasing material monitoring scrutiny. When continuous manufacturing uses product and process knowledge with properly implemented online process analytical technology, it can meet the criteria required to enable real-time release testing, leading to rapid and reliable batch release of high-quality product (see Figures 2 and 3 for continuous manufacturing processes for small and large molecules, respectively). Despite these vast advantages, continuous manufacturing also has significant challenges, and continued focus by industry and regulators is required to resolve them.
In the chemical processing field, the residence time distribution is used to describe how a material travels inside the unit operations of a continuous process system. Residence time distribution is a critical tool in pharmaceutical process understanding, quality assurance, and equipment and sensing design, but it is underutilized due to a lack of acceptance of residence time distribution as an alternative to testing, especially if an automated residence time distribution control system is available as part of the line.
As mentioned, process analytical technology can be a useful tool as part of the control strategy, which is generally developed and initially implemented for production of clinical trial materials. The control strategy is usually refined for use in commercial manufacture as new knowledge is gained. Changes could involve ac-ceptance criteria, analytical methodology (including switching from traditional lab testing to process analytical technology or model-based methods), or the points of control (e.g., introduction of real-time release testing). Stakeholders across an organization must agree whether the documentation and equipment qualification of any process analytical technology tool done during development activities are sufficient to permit the leveraging of the development data into a final real-time release testing method that incorporates increased process knowledge and finalized process controls. Additional emphasis on process controls should be considered in cases where products cannot be well characterized or quality attributes might not be readily measurable due to limitations of testing or detectability (e.g., microbial load/sterility, low drug load).
PAT Validation and Life-Cycle Management
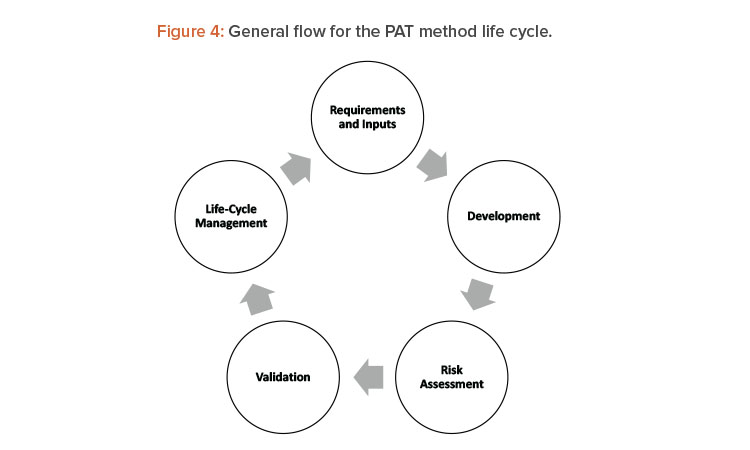
As noted previously, process analytical technology benefits a continuous manufacturing line by helping answer technical and quality-related questions about product and process performance, and by providing the direct answer to product quality requirements. As mentioned, the main hurdles of validation strategy of the process analytical technology and the accompanying methods arise during development. The qualification and validation of process analytical technology applications have significant overlap with traditional analytical equipment qualification and validation and should be conducted in accordance with ICH Q2 (R1),13 where the capabilities of the equipment must align with the type of test that the technology will address (ID, qualitative, or quantitative measure). Whenprocess analytical technology is incorporated into the manufacturing process as in-line or online tools, additional issues such as probe fouling and complexity of continuous manufacturing cleaning validation should be addressed. Some examples of how to incorporate these aspects into the line risk analysis are described in detail in ASTM standard E2898-1414 Figure 4 shows the life cycle for method development and validation of analytical methods for process analytical technology applications that is aligned with E2898-14.
E2898-14 includes paths for process analytical technology method validation, including how a risk assessment can document a risk-based approach that identifies what parameters to address based on the use of the process analytical technology tool and how each parameter should be handled. (This risk-based approach can be found in ASTM E2476.15)
Examples of potential areas for confusion around validation requirements in the pharmaceutical industry include:
- How to translate the risk-based approach for a scenario in which process analytical technology is used for divert to waste and not part of the final product release strategy
- How to validate the process analytical technology measurement if equivalency to a traditional method is not feasible or no traditional methodology is available
- How to leverage development work or data generation when the model is of a lower impact level (Table 1)
Internal education of employees regarding the similarities and differences between process analytical technology and traditional testing is essential to successfully implement and sustain process analytical technology as a tool for ensuring quality. Training programs are needed for all levels of the organization; the scope of education will range from awareness to detailed training in how to install and maintain the process analytical technology, including interfaces with the manufacturing line.
Many common process analytical technology tools require the use of chemometric models to generate the required data. At any stage during the life cycle of the application (e.g., feasibility, development, validation, or routine use for product manufacture), the level of validation of the model, and thereby the validation of the test method, must be aligned with the impact of the application at that time (Figure 1). Table 1 categorizes the impact of the model use into three levels16 and presents examples and the proposed level of validation/documentation appropriate for the situations.
| Category | Impact Level | ||
|---|---|---|---|
| Low | Medium | High | |
| Model use | To support product or process development | To help ensure product quality (model predictions are not the sole indicator of product quality) |
To predict product quality (model predictions are significant indicators of product quality) |
| Examples | Formulation, process optimization, and scaling | Design space models, in-process control models; PAT for process control when not part of control strategy | Chemometric models for product assay, surrogate model for dissolution PAT for process control when part of registered control strategy |
| Validation | Formal validation is unlikely Method development will not include all variability expected in commercial manufacturing |
Limited validation may be appropriate | Full model validation is done following relevant guidelines |
| Documentation | Includes discussion of how the models were developed and used to guide process development | Model assumptions; a tabular or graphical summary of model inputs and outputs; relevant model equations (e.g., for mechanistic models) either in the submission or via a reference; statistical analysis where appropriate; a comparison of model predictions with measured data; and a discussion of how the other elements in the control strategy help mitigate uncertainty in the model, if appropriate | Data and prior knowledge (e.g., for established first principles–driven models), such as model assumptions; appropriateness of the sample size, number, and distribution of samples; data pretreatment; justification for variable selection; model inputs and outputs; model equations; statistical analysis of data showing fit and prediction ability; rationale for setting of model acceptance criteria; model validation (internal and external); and a general discussion of approaches for model verification during the life cycle |
Table 1 captures the current information from the FDA guidance document16 and shows that the regulatory expectation on validation and documentation increases as the potential impact of the model on quality increases. The information in Table 1 and the FDA guidance16 can be leveraged to create appropriate internal requirements depending on the intended use of a model at any phase of the process analytical technology life cycle. It should be noted that based on long-term intent of a model, a company can decide to increase the validation and documentation requirements at an earlier phase of application development to facilitate the end use. In a similar manner, qualification activities may be performed earlier for chemical manufacturing control (CMC) deliverables.
Regulatory guidance documents for near-infrared spectroscopy (NIRS) cover what is in or out of scope. For example, European Medicines Agency (EMA) near-infrared spectroscopy guidance17 states that “NIRS for non-regulatory purposes, such as generating process knowledge, is out of scope of this guideline.” FDA guidance on near-infrared spectroscopy 18 applies to applications used “during the manufacture and analysis of pharmaceuticals (including raw materials, in-process materials and intermediates, and finished products).” It is generally assumed that this FDA guidance applies to applications that will be included in regulatory submissions aligned with European Medicines Agency near-infrared spectroscopy guidance, although that is not specifically stated. The FDA and European Medicines Agency near-infrared spectroscopy guidance can be applied to similar process analytical technology technologies.
According to current guidance documents, organizations must obtain additional regulatory approval during the life cycle of the process analytical technology application. This is a challenge, and it is compounded by the differences in the requirements of various regulatory bodies. Certain changes to the scope of the near-infrared spectroscopy method (European Medicines Agency guidance) require regulatory notification and acceptance before a model update can be implemented.19 FDA guidance also requires a prior approval supplement when there are major changes to the application or a change-being-effected in 30 days (CBE-30) filing for a moderate change. If theprocess analytical technology application were required to manufacture using continuous processing, manufacture would have to cease during this time period unless an alternative control strategy that did not rely on the process analytical technology application were accepted by regulatory authorities.
The following are two potential solutions to mitigate this challenge in European Medicines Agency guidance and general expectations of approval of model changes:
- The use of performance-based established conditions (ECs) for process analytical technology methods versus parameter-based established conditions: This option would require a clear description of model outputs that must be met, such as accuracy, precision, linearity, and so on, instead of just the software version, spectral pretreatment, and equipment model. If performance-based established conditions were used, a range of changes to the process analytical technology method would not require a filing because those changes would be verified through the confirmation of the output and tracked within the pharmaceutical quality system (PQS).
- The use of postapproval change management protocol (PACMP): This is a two-step process. First, the organization submits a written protocol that de-scribes the proposed change, its rationale, and risk management, as well as proposed studies and acceptance criteria to assess the impact of the change(s). Regulatory authorities must approve this protocol in advance of the implementation of the proposed change(s). Second, the organization submits the actual results/data based on the protocol approved by the regulatory authorities and according to the agreed categorization (classification). In certain cases (e.g., noncritical or repetitive changes), regulatory approval of the second step may not be required because that step will be managed within the applicant’s pharmaceutical quality system.
The second approach can result in the downgrade of notification requirements (e.g., 1B to 1AIN), which could obviate the need to halt continuous manufacturing while awaiting regulatory approval. Overall, this is an area of ongoing conversation between industry and regulators.
The goal of process analytical technology model validation is to have a fit-for-purpose validation and documentation approach for model use. In general, industry stakeholders agree on health authority expectations for low- and high-impact models. The requirements for medium-impact models are less clear.
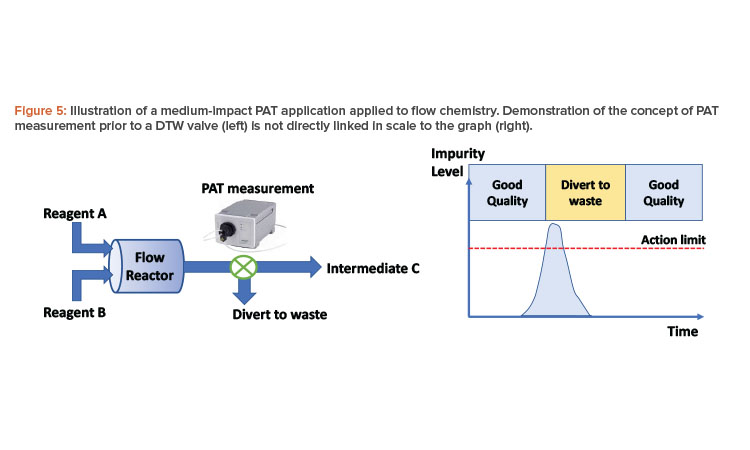
Consider the following example, in which two reagents (A and B) are reacted together in a single-stage flow process to form an intermediate (C) of a multistage synthetic process (Figure 5). A process analytical technology measurement is made at the exit of the reactor, which is capable of quantifying an impurity in solution that is difficult to purge and can impact API quality downstream. Intermediate (C) is collected in a batch vessel, sampled for analysis, and tested against a specification, irrespective of the process analytical technology measurement. This offline analysis forms the basis for ensuring control of the impurity. However, using process analytical technology to DTW at the appropriate times can reduce the level of impurity in the intermediate or potentially prevent a batch failure. (With enhanced confidence in the process analytical technology method and residence time distributions, the extended DTW time shown in Figure 5 may be reduced to match the point where the impurity is below the action limit.)
In this case, the application should be considered medium impact. The level of assurance required for this process analytical technology measurement is less than if the impurity were not controlled by subsequent downstream analysis, and the process can run without the process analytical technology measurement. Fit-for-purpose application validation is required, as this is a business risk and presents no risk to the patient.
Similarly, consider a process analytical technology measurement performed on a mixture or blend for an oral solid dose formulation used to ensure proper composition to determine when to DTW. If the final product has another process analytical technology or traditional test with appropriate sampling frequency, this initial process analytical technology method is considered medium impact, and limited validation and model maintenance requirements are required.
Indirect PAT Approaches: Soft Sensors and Digital Twins
The previous sections focused on direct process analytical technology approaches; however, many products are too complex to measure all critical quality attributes in real time. In many cases, a process variable or a critical quality attribute is considered hardly measurable because the measurement is not specific enough, the resolution does not suffice, or the vari-able is intracellular (in the case of biologics). In these situations, indirect measurement and correlation techniques are needed, and soft sensors, which use a combination of other measurements and mathematical calibration algorithms to accurately predict potentially difficult to measure variables, can be used.
There are multiple approaches for the generation of soft sensors.20 The most desirable soft sensors are fully mechanistic ones, which use first-principle approaches, such as energy, mass, and elemental balances.21 When complexity must increase to accurately predict the target variable, mechanistic modeling approaches are appended with data-driven correlations (also called hybrid models).22
Mechanistic or hybrid kinetic models can be implemented in a real-time environment and thereby mimic the process as a digital twin. Digital twins can be used to estimate the current state of process variables by using observed algorithms, such as Kalman or particle filters. Furthermore, they allow prediction and (model-predictive) process control, a key requirement for continuous bioprocessing.23 Because digital twins derive variables that can-not be easily measured, they can even be used as tools for controlling on variables that are normally not measurable. Hence, together with workflows known as “good modeling practice,” digital twins provide means to measure less and allow new opportunities for extended experimental design and enhanced process characterization.24 Although these techniques are good to predict performance, they have limited use for establishing release criteria.
Overall, the quality requirements—and, thereby, the quality systems—are not changed by the implementation of continuous manufacturing.
Method and Model Updates
Process analytical technology methods focused on product life-cycle management (ICH Q12) require routine verification of performance beyond what is required for traditional test methods. Enhanced attention must be given to the validation of the models, as well as the continued verification that the model is operating in its validated space. Therefore, computational model life-cycle management, which includes routines for model diagnosis and drift detection, must be established.25 This will enable identification of a transition point where models are allowed to self-learn on additional data sets, or where the model needs to be maintained by process experts. More research is required on the following questions: What would be necessary to allow a self-tuning model? What would preclude a self-tuning model and would require a process expert’s intervention? How would life-cycle management be performed?
Q12 is proposed as the update mechanism for changes to all models, such as addition of spectra to a model or providing proof of being able to use a model for real-time release testing. Many strategies for self-learning algorithms have been in place for many years and will be enhanced by machine learning and artificial intelligence strategies in the future. However, the changes to a digital twin and soft sensor must remain traceable in a GxP environment. Moreover, the validated space of the method/model must be declared, and data integrity must be ensured, which can be a challenging task for data-driven approaches and will be a research field in the near future. We need to address questions such as the following: Do sufficient criteria exist to declare the validated space and ensure data integrity? If the validated space changes from a previously approved model but is irrelevant for the operating space, is this a mod-el change? In many cases, mechanistic approaches are encouraged because model parameters have a mechanistic meaning. Their value can be compared to literature values, which allows easier validation, and can therefore be easier to interpret and judge for model validity during unforeseen perturbations.
Another potential solution is to allow for the use of “or equivalent” with process analytical technology methods, similar to what is done with traditional analytical methods, and only the spectra that were part of the original validation would be used for these equivalency assessments. To make this approach possible, updates to current regulatory guidance documents would be required, as described in the process analytical technology validation section. If updates to guidance documents to allow for “or equivalent” can be realized, certain activities, such as the addition of a second software and the addition of a second analyzer of the exact same model with no change in original acceptance criteria, could be captured within the quality system. This would simplify reporting because changes could be submitted as part of the annual report instead of in a regulatory filing.
Other Potential Hurdles
When process analytical technology is used in a continuous manufacturing process, the number of data points or measurements will be significantly higher than with a traditional batch process. This greater amount of data allows for the use of alternative statistical methodologies to show product quality, but it also requires additional discussions and strategies around sampling plans, as discussed in detail by De Los Santos and colleagues.26 Overall, the quality requirements—and, thereby, the quality systems—are not changed by the implementation of continuous manufacturing. However, timing and responsibilities for activities such as batch review, release strategy, stability strategy, rejection strategy, and contingency plans for process analytical technology may change.
As discussed previously, in continuous manufacturing, some activities may shift to an earlier phase in the manufacturing process development, especially because the pro-cess may be developed at scale. Similarly, process validation may also be done sooner because a continuous manufacturing line is more integrated than traditional batch pro-cesses (as discussed by the FDA in new draft guidance for continuous manufacturing [2]). The combination of process analytical technology with continuous manufacturing may enable continuous process verification because it allows for immediate feedback of process performance and the use of a QbD approach if used throughout development.
Contingency Plan For PAT
As described in guidance documents,17, 18 regulators expect that organizations will include a contingency plan as part of the strategy when implementing process analytical technology. A range of potential approaches can be taken with respect to the contingency plan, and each has its own advantages and disadvantages.
Multiple PAT
One option for contingency planning involves creating a line with multiple equivalent process analytical technology tools for a specific measurement. This can be done by ensuring available backup process analytical technology tools to insert into the line when the “primary” tool goes down, or the organization can have multiple tools built into the line at equivalent points to measure the same parameter.
It is critical that organizations have a predetermined, scientific and risk-based strategy around hierarchy of the multiple values/process analytical technology outputs during routine operation to eliminate confusion. The backup process analytical technology tool can also be offline equipment not intended for direct connection to the line.
Alternative Test Methods
If process analytical technology is unavailable, or does not function as expected (i.e., does not pass suitability tests), alternative or traditional test methods can be employed. It should be noted that this statement only applies to scenarios where the testing method has been appropriately documented through the control strat-egy and overall product risk. One drawback to this approach is the organization may need to collect a high volume of samples to show process control. Also, the traditional test usually takes longer than the process analytical technology test and can delay product release, especially if real-time release testing is employed.
Shutdown
If an organization uses process analytical technology but does not use multiple process analytical technology tools or an alternative test method as the contingency plan, it may need to shut down the line if the process analytical technology is unavailable. In this scenario, no product is manufactured until the process analytical technology tool is again available. This will require the organization to maintain higher inventory volumes to minimize the risk for potential out-of-stock events, which can be cost prohibitive. The benefits, although minor, of this ap-proach are that the organization will not require additional process analytical technology tools or analytical equipment as part of its upfront investment and long-term mainte-nance costs may be lower.
If a company is not willing to invest in backup process analytical technology, they are also less likely to implement process analytical technology from the start due to the high risk of not being able to run the standard planned commercial process or meet the demand plan. This can then lead to drug shortages, as noted previously, which is otherwise a problem that continuous manufacturing can alleviate.
Conclusion
Throughout this article, we have shown how process analytical technology can aid in the implementation of continuous manufacturing throughout the life cycle and have highlighted areas of concern for process analytical technology implementation. Based on the product and company strategy, process analytical technology can be used for process development, control, monitoring, and product re-lease. Guidance documents are clear on the requirements and expectations for process analytical technology when used for real-time release or to make final quality decisions. However, there are major hurdles for increased implementation of process analytical technology within continuous manufacturing, for which we have proposed some solutions:
- Validation requirements for medium-impact models.
- Model maintenance and updates: Guidance documents from various health authorities offer differing requirements regarding the expectations for model maintenance. Our recommendation is to continue harmonization discussions as Q13 and Q14 are being drafted to clearly capture what is expected and to align expectations with requirements for traditional test methods. Also, by shifting to a performance- versus-parameter-based description of methods, more changes can be managed through the pharmaceutical quality system instead of in regulatory filings. This would decrease the time requirement for implementa-tion of a change and allow for increased use of process analytical technology.
- Processes and system for traceability: The use of process analytical technology requires models, which need to be adjusted throughout the product life cycle. Therefore, it is critical to have tools to trace the need to adapt the models in a GxP environment. Workflows and decision trees must be available as data science solutions.
- Skills, knowledge, and mindset within the organization: It is important to share knowledge and develop the skill set of the entire organization from the introduction of process analytical technology and continuous manufacturing to allow for better understanding and sustainability of these initiatives.
- Business case requirements: Companies need to think holistically about how they develop the business requirements for and benefits of process analytical technology. The first application will always be relatively costly and time consuming; however, once the tool and the skills are in place, companies can realize significant benefits at significantly lower costs. Through the use of process analytical technology, companies may also increase overall knowledge of the process, which supports the holis-tic approach to the business case.
- Options when unable to measure all critical quality attributes with process analytical technology: Companies should acknowledge these issues and develop appropriate processes for modeling if process analytical technology tools are unavailable.
- Software solutions: Workflows for digital twins are in place; however, a digital twin needs a suitable real-time environment, and standardization is key in this respect; therefore, the industry needs software as a service (SaaS) solutions.
About the Authors