Technical
March / April 2020

Effects of Tank-Agitated Fermentation on Therapeutic mAb Quality

Anelis Quintana Cantillo, MSc
Wendy Montero Pérez
Azalia De La Caridad Rodríguez Taño, MSc
Olga Lidia Fernandez Saez
Leina Moro Pérez
Alexi Bueno Soler
José Luis Durán
José Arquímides Castro Del Pino
Tammy Boggiano Ayo
Figure 4: SDS-PAGE under nonreduced conditions of the fi nal purified SP Sepharose Fast Flow.

Regulatory authorities have approved the use of recombinant monoclonal antibodies (mAbs) to treat infectious diseases1  and chronic conditions such as cancer2  and inflammatory diseases.3 Recently, biosimilar antibodies have been developed to increase product availability and lower prices. The production of therapeutic antibodies is mainly carried out in mammalian host cell lines, which include NS0 murine myeloma cells, human PER.C6 cells, and Chinese hamster ovary (CHO) cells,4  due to their ability to synthetize human protein–like molecular structures. The production process for these products must maintain the desired quality while providing manufacturing flexibility and maintaining profitability.

  • 1Sparrow, E., M. Friede, M. Sheikh, and S. Torvaldsen. “Therapeutic Antibodies for Infectious Diseases.” Bulletin of the World Health Organization 95, no. 3 (2017):235–237. doi:10.2471/BLT.16.178061
  • 2Chiavenna, S. M., J. P. Jaworski, and A. Vendrell. “State of the Art in Anti-Cancer mAbs.” Journal of Biomedical Science 24, no. 1 (2017): 15. doi:10.1186/s12929-016-0311-y
  • 3Campbell, J., D. Lowe, M. A. Sleeman. “Developing the Next Generation of Monoclonal Antibodies for the Treatment of Rheumatoid Arthritis.” British Journal of Pharmacology 162, no. 7 (2011): 1470–1484. doi:10.1111/j.1476-5381.2010.01183.x
  • 4Chartrain, M., and L. Chu. “Development and Production of Commercial Therapeutic Monoclonal Antibodies in Mammalian Cell Expression Systems: An Overview of the Current Upstream Technologies.” Current Pharmaceutical Biotechnology 9, no 6 (2008): 447–467. doi:10.2174/138920108786786367

This article describes experiments carried out to evaluate the impact of physical variables of agitated tank fermentation on the process performance and product quality profile of therapeutic mAbs. The aim of these experiments was to develop a consistent fermentation manufacturing process5 for a therapeutic biosimilar mAb that would maintain the desired quality attributes. Fractional experimental design allows the evaluation of culture media, temperature, airflow, and agitation speed variations on product purity, isoforms composition, secondary and tertiary structure, and ligand binding.

Materials and Methods

Fermentation Process

An NS0 cell line clone producing a chimeric IgG1 mAb was grown in 2-liter (L) stirred bioreactors (Applikon, The Netherlands) in perfusion. The bioreactors were seeded at 5×10⁵ cells/mL, and dilution velocity was increased considering a cell-specific perfusion rate of 0.1 nL/cell/day.

Experiments to elucidate the impact of media and fermentation process parameters were carried out as a reduced two-level factorial with two center points. A commercial media formulation (CMF; a commercially available protein-free hybridoma medium [PFHM-II]) and a mix of CMF and a proprietary media formulation (MB02) 50/50 volume per volume (v/v) were assessed. Impellent tip speed ranged from 0.6 to 1.0 m/s, airflow from 0.0075 air volume per medium volume per min (vvm) to 0.0225 vvm, and temperature from 34°C to 37°C (Table 1); pH was set between 6.8 and 7.2, and the dissolved oxygen concentration upper limit was set to 50% ± 5%.

To monitor cell density, viability, and IgG concentration, 30-mL samples were collected daily. Cells were counted in a Neubauer improved hemocytometer; cell concentration and viability were assessed by the trypan blue exclusion method; and IgG concentration was determined by ELISA.6. . Perfusion supernatant was filtered through a 3-mm to 0.2-mm filter tandem prior to the purification process.

To set the key process parameter of fermentation operation, a numerical optimization function was made using Design-Expert 6.0.1 software.

Purification Process

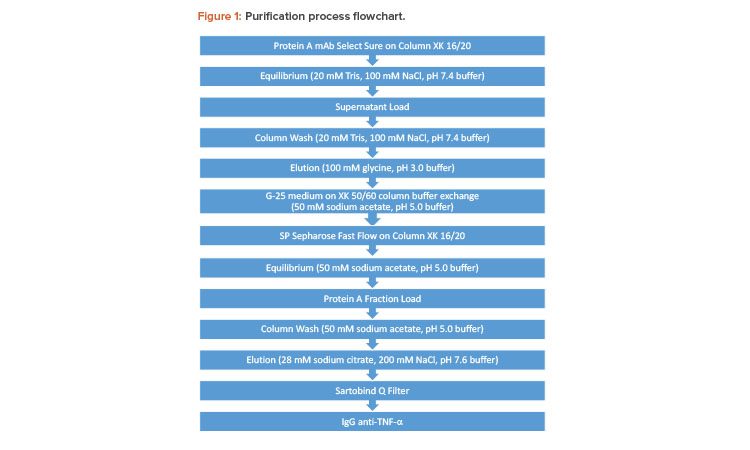
Figure 1 depicts the mAb purification process. The mAb preparation was loaded onto a protein A support equilibrated with 200 mM Tris, 100 mM NaCl, pH 7.4 buffer, and eluted from the protein A support with 100 mM glycine, pH 3.0 buffer. The eluate comprising the mAb was buffer-exchanged on G-25 medium. It was subsequently loaded onto a cation-exchange (CEX) chromatography support equilibrated with 50 mM sodium acetate, pH 5.0 buffer; eluted with 28 mM sodium citrate, 200 mM NaCl, pH 7.6 buffer; and finally filtered through a Sartobind Q filter. The absorbance units were measured at 280 nm.


Table 1: Factorial design runs for four factors applied to the development of the process design space of an mAb.
Condition Media Stirring,
rpm (m/s)
Airflow,
vvm
Temperature,
°C
1 CMF 150.00 (0.4) 0.0075 37.00
2 CMF 450.00 (1.2) 0.0225 34.00
3 CMF 150.00 (0.4) 0.0225 37.00
4 CMF 450.00 (1.2) 0.0075 34.00
10 CMF 300.00 (0.8) 0.0150 35.50
5 CMF/MB02 150.00 (0.4) 0.0075 34.00
6 CMF/MB02 450.00 (1.2) 0.0225 37.00
7 CMF/MB02 450.00 (1.2) 0.0075 37.00
8 CMF/MB02 150.00 (0.4) 0.0225 34.00
9 CMF/MB02 300.00 (0.8) 0.0150 35.50

Physicochemical Characterization

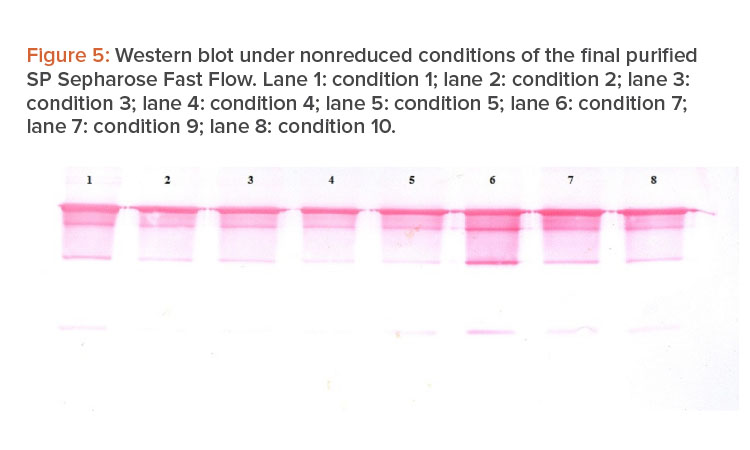
SDS-PAGE Under Nonreducing Conditions and Western Blot

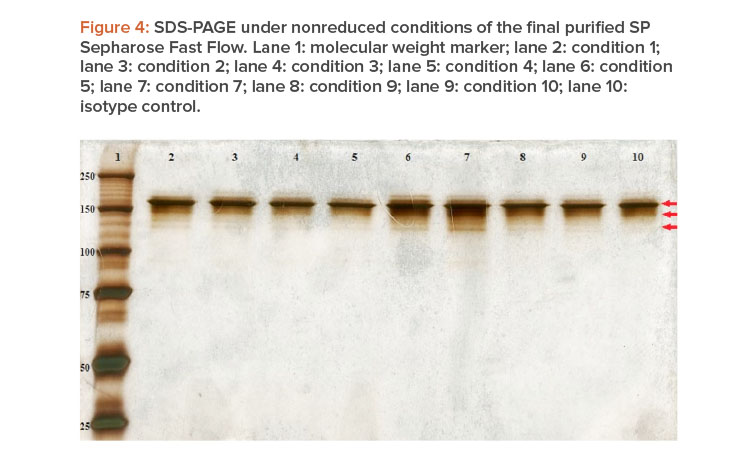
Sodium dodecyl sulfate polycrylamide gel electrophoresis (SDS-PAGE) is a common technology for antibody-purity analysis. In this case, purified mAbs were resolved on 7.5% polyacrylamide gels under nonreducing conditions followed by silver nitrate staining.

For western blot analysis, proteins were transferred to a 0.45-mm nitrocellulose membrane (Whatman), blocked with 5% skim milk (Fluka) in Tris-buffered saline and probed with goat anti-human-gamma-chain-specific phosphatase alkaline–conjugated antibodies (Sigma) diluted in phosphate-buffered saline (PBS) with 0.1% TWEEN 20. The western blot was developed with Fast Red detection reagent (Sigma).

Size Exclusion Chromatography (SEC)

Chromatographic analyses were performed on a high-performance liquid chromatography (HPLC) system (Shimadzu, Kyoto, Japan). SEC was performed using a TSKgel G3000SWXL column (Tosoh Bioscience, Stuttgart, Germany). Samples (500 μg) were injected, and UV detection was carried out at 280 nm.

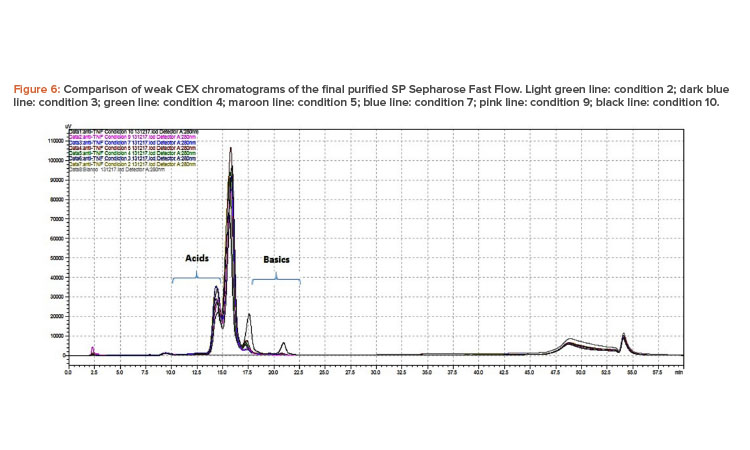
Cation-Exchange (CEX) Chromatography

CEX separation was performed using a weak CEX resin (ProPac WCX-10, 4×250 mm, Dionex, Germering, Germany). The mobile phases used were mobile phase A (0.01 M sodium phosphate buffer, pH 6.6) and mobile phase B (0.01 M sodium phosphate buffer + 0.5 M NaCl, pH 6.6). The elution was performed by an ascending gradient from 4% to 80% eluent B before the eluent composition was returned to the starting condition (100% eluent A). UV detection was carried out at 280 nm.


  • 5Li, F., N. Vijayasankaran, A. Shen, R. Kiss, and A. Amanullah. “Cell Culture Processes for Monoclonal Antibody Production.” MAbs 2, no. 5 (2010): 466–479. doi:10.4161/mabs.2.5.12720
  • 6.López-Requena, A., C. M. De Acosta, E. Moreno, M. González, Y. Puchades, A. Talavera, and R. Pérez. “Gangliosides, Ab1 and Ab2 Antibodies: I. Towards a Molecular Dissection of an Idiotype–Anti-Idiotype System.” Molecular Immunology 44, no. 4 (2007): 423–433.
Figure 1: Purification process flowchart.

Circular Dichroism (CD) Spectroscopy

CD experiments were performed using a Jasco J-1500 spectropolarimeter equipped with Jasco PTC-510 Peltier thermostatted cell holders to control temperature and a Jasco MCB-100 mini–water circulation bath (Jasco Corporation, Japan). The far-UV-CD spectra were obtained in the range of 200–250 nm, in quartz cuvettes of 0.1 cm optical path. The spectra were recorded at 0.1-nm intervals, at a constant speed of 100 nm/min with 1-second response time, 1 nm bandwidth, and 15 accumulations. The protein concentration was 0.3 mg/mL for far-UV-CD. The baseline was corrected in all experiments, using as a control the patient solution, 10 mM sodium phosphate buffer. Noise reduction was applied to the baseline-corrected protein spectra using the smoothing option of the device’s Spectra Manager II software (Jasco) and the final construction of the graphic in Origin 8.0 software (Origin Lab Corporation, US). The influence of the differences in protein concentration between the batches was minimized by representing the spectra by a scaling factor.

Fluorescence (FL) Spectroscopy

The fluorescence spectra were recorded on a Jasco J-1500 spectropolarimeter equipped with a Jasco FMO-522 fluorescence monochromator (fluorescence detector Jasco FDT-538), Jasco PTC-510 Peltier temperature controller, and Jasco MCB-100 water circulation mini-bath. The emission spectra of intrinsic fluorescence of proteins were measured in the range of 300–450 nm, every 1 nm, with 1-second response time and 1 accumulation, after excitation at 295 nm, to obtain fluorescence spectra derived from the tryptophan (Trp) residues. Bandwidths of 5 and 10 nm were used for excitation and emission, respectively. The protein concentration used was 0.15 mg/mL, using quartz cuvettes of 10 mm optical path. The baseline was corrected in all experiments using as a control the patient solution, 10 mM sodium phosphate buffer. Noise reduction was applied to the baseline-corrected protein spectra using the smoothing option of the device’s Spectra Manager II software and the final construction of the graphic in Origin 8.0 program.

Determination of Binding Affinity to the Ligand

Binding affinity was carried out through molecular recognition using an ELISA system. The polystyrene microtiter plates (high binding, Costar, 3590) were coated with 100 μL per well of a solution at 1 μg/mL of tumor necrosis factor-alpha (TNF-α) in coating buffer (carbonate-bicarbonate 0.01 mol/L, pH 9.8), overnight at 4°C.

The plates were washed with phosphate-buffered solution, 0.5% Tween 20 (PBS-t, pH 7.5), and then the plates were blocked with 200 μL per well of a solution of PBS-t and bovine serum albumin (Sigma 3294) at 1% for 1 hour at RT. The plates were washed with PBS-t. The diluted samples were added in a range of 1,000 ng/mL to 0.1 ng/mL, 100 μL per well, in the blocking solution at RT for 1 hour. The plates were washed with PBS-t, 100 μL per well; then, the secondary antibody, anti-human IgG goat serum conjugated to alkaline phosphatase (Sigma, A3188) at a dilution of 1:4000, was added. The plates were washed with PBS-t, 100 μL per well, and, finally, the substrate p-nitrophenylphosphate (1 mg/mL, Boehringer Mannheim GmbH, 107.905) in diethanolamine buffer (pH 9.8) was added. The data were read at 15 minutes at 405 nm, and the results were processed on a Microsoft Excel spread-sheet designed for that purpose.

Results and Discussion

Definition of Fermentation Process Key Parameters

The impact of the operation parameters on the stirred tank fermentation process was assessed at 2-L scale with two culture media. Impeller speed, air-flow, and temperature were combined in 10 fractional factorial design perfusion runs (Table 1). Significant differences were found for integral viable cell concentration (IVCC) values during the perfusion runs studied (Figure 2). The adjusted model (which has a correlation coefficient of 95.29%) showed as significant input variables the airflow (P = 0.0301), the interaction between agitation and temperature (P = 0.0214), and the interaction between temperature and the airflow (P = 0.0344). Our results showed that IVCC decreased due to the decrease of viable cell concentration in correspondence with the increase of the three studied parameters.

In the case of temperature, the behavior in our experiments was different from that usually reported in the literature; in other reports, decreases in temperature induce slower growth7 due to the arrest of cells in G1 phase, which can increase the longevity because of prolonged cell viability.8


  • 7Yoon, S. K., Y. H. Ahn, and M. H. Jeong. “Effect of Culture Temperature on Follicle-Stimulating Hormone Production by Chinese Hamster Ovary Cells In A Perfusion Bioreactor.” Applied Microbiology and Biotechnology 76, no. 1 (2007): 83–89. doi:10.1007/s00253-007-0985-x
  • 8Marchant, R. J., M. B. Al-Fageeh, M. F. Underhill, A. J. Racher, and C. M. Smales. “Metabolic Rates, Growth Phase, and mRNA Levels Influence Cell-Specific Antibody Production Levels from In Vitro-Cultured Mammalian Cells at Sub-Physiological Temperatures.” Molecular Biotechnology 39, no. 1 (2008): 69–77. doi:10.1007/s12033-008-9032-0
Figure 2: Comparison of IVCC of 2-L-scale stirred tank perfusion conditions evaluated in the fractional factorial experiment.

Figure 3: Comparison of volumetric productivity of 2-L-scale stirred tank perfusion conditions evaluated in the fractional factorial experiment.

In the adjusted model, the growth rate (which has a correlation coefficient of 99.53%) was significantly negatively affected by the cell culture media (P = 0.0111), airflow (P = 0.0036), temperature (P = 0.0132), interaction between culture media and airflow (P = 0.0074), interaction between agitation and temperature (P = 0.0020), and interaction between temperature and airflow (P = 0.0049). The increase in airflow and temperature decreased the cell growth rate. This phenomenon is associated with an increase in hydrodynamic stress in which the growth of cells is restricted by agitation. The stress generated by bursting bubbles could also develop a mediator transcription response for cytoskeleton repair.9

For the model adjusted for the production rate (which has a correlation coefficient of 89.94%), no process parameters significantly influenced the output variable. However, volumetric productivity (Figure 3) is negatively affected by tip speed (P = 0.044), being more productive in those runs of low-er agitation stress. This could be a concern because at low agitation rates, nutrient mixing could be insufficient and cells could settle in the bioreactor.

The resulting data indicated that airflow, temperature, and agitation speed are key parameters for the consistent performance of the fermentation process. Therefore, the optimal conditions of fermentation operation were determined using a numerical optimization function, taking into consideration the culture medium as a single variable because it presented only a significant individual contribution in the growth rate. The equivalent to the range between 0.8 and 1.0 m/s of tip speed (300–400 rpm at 2-L scale) was taken as a range to guarantee the subsequent scaling of the process. With this restriction, the model indicates the possibility of working between 0.008 and 0.014 vvm and with a temperature between 35.6°C and 36.5°C. This range of airflow is similar to others used in the literature (0.004–0.15 vvm)10 to eliminate the carbon dioxide produced in cellular respiration and guarantee the oxygen consumption of culture.


  • 9Sieck, J. B., W. E. Budach, Z. Suemeghy, C. Leist, T. K. Villiger, M. Morbidelli, and M. Soos. “Adaptation for Survival: Phenotype and Transcriptome Response of CHO cells to Elevated Stress Induced by Agitation and Sparging.” Journal of Biotechnology 189 (2014): 94–103. doi:10.1016/j.jbiotec.2014.08.042
  • 10Xu, S., and H. Chen. “High-Density Mammalian Cell Cultures in Stirred-Tank Bioreactor Without External pH Control.” Journal of Biotechnology 231 (2016): 149–159. doi:10.1016/j.jbiotec.2016.06.019
Figure 4: SDS-PAGE under nonreduced conditions of the final purified SP Sepharose Fast Flow.

Figure 5: Western blot under nonreduced conditions of the fi nal purified SP Sepharose Fast Flow.

Physicochemical Characterization

Determination of Purity by SDS-PAGE and Western Blot

Antibody-purity analysis is critical to successful development of mAb biopharmaceuticals. Figure 4 shows the purity pattern of the preparations obtained from the supernatants under different fermentation conditions. In almost all cases, three bands were observed. The first one, which is of greater intensity, corresponds to the intact molecule, and the two lower ones correspond to molecules in which one (or both) of the light chains has been lost.11 Differences in the intensity of the different molecular variants can be appreciated: the purity for conditions 2, 3, and 4 main bands was greater than 95%, and the purity for all other conditions was below this value; however, statistical differences were not found (P = 0.4737). Those samples with less purity showed bands at lower molecular weights. Some authors have attributed this type of finding to artifacts formed during sample preparation.12  In our opinion, however, this is not the case because the same processing protocol was used for all samples; therefore, this finding might be related to other operational variables of the production process. However, it should be noted that only the typical antibodies’ three bands composed all samples.

All bands observed in SDS-PAGE were identified by western blot (Figure 5), except for a band of much lower molecular weight, which can be seen in the lanes of conditions 1, 5, 7, 9, and 10, and could correspond to a heavy chain band of about 50 kDa. These results confirmed that the preparations obtained are composed of the mAb with a high degree of purity.

Determination of Aggregates

SEC was performed to detect the levels of aggregates, monomers, and fragments. A characteristic HPLC-GF chromatogram of SP Sepharose Fast Flow eluates presented a characteristic peak of the antibody that appeared in a retention time oscillating between 7.51 and 7.87 minutes; the variability be-tween them was 1.57%, which indicates that the majority peak elution behaved similarly in the eight fermentation conditions. In addition, a smaller peak representative of the dimers was observed at values between 6.59 and 6.82 minutes and a variability of 1.32%.

Purity values obtained in the eight fermentation conditions ranged between 99.76% and 99.89%, which indicated a high purity of the molecule obtained in the eight conditions and coincided with other related findings. The variability between the peaks of monomers of the eight purified material was 0.14%; that was below 2%, which is the accepted limit for the accuracy in a single day for this type of test.13

The statistical analysis performed shows that there were no significant differences in the content of soluble aggregates in the eight conditions evaluated (P = 0.2664).

CEX Chromatography

Monoclonal antibodies show heterogeneity derived from posttranslational modifications that include deamidation, glycosylation, oxidation, aggregation, proteolytic degradation, and disulfide bridge formation. Of these modifications, oxidation, deamidation, and proteolytic degradation give rise to charge heterogeneity; therefore, weak ion exchange chromatography is used to analyze this variability in therapeutic antibodies14


  • 11Beck, A., H. Diemer, D. Ayoub, F. Debaene, et al. “Analytical Characterization of Biosimilar Antibodies and Fc-Fusion Proteins.: TrAC Trends in Analytical Chemistry 48 (2013): 81–95. doi:10.1016/j.trac.2013.02.014
  • 12Liu, H., G. Gaza-Bulseco, C. Chumsae, and A. Newby-Kew. “Characterization of Lower Molecular Weight Artifact Bands of Recombinant Monoclonal IgG1 Antibodies on Non-Reducing SDS-PAGE.” Biotechnology Letters 29, no. 11 (2007): 1611–1622. doi:10.1007/s10529-007-9449-8
  • 13Navas, N., A. Herrera, A. Martínez, A. Salmerón, J. Cabeza, and L. Cuadros. “Quantification of an Intact Monoclonal Antibody, Rituximab, by (RP) HPLC/DAD in Compliance with ICH Guidelines.” Analytical and Bioanalytical Chemistry 405, no. 29 (2013): 9351–9363. doi:10.1007/s00216-013-7368-1
  • 14Vlasak, J., and R. Ionescu. “Heterogeneity of Monoclonal Antibodies Revealed by Charge-Sensitive Methods.” Current Pharmaceutical Biotechnology 9, no. 6 (2008): 468–481.
Figure 6: Comparison of weak CEX chromatograms of the final purified SP Sepharose Fast Flow.

Figure 6 shows the superimposed chromatograms of the samples analyzed. The integration of the chromatograms shows the existence of four peaks, a major peak of neutral isoforms, one peak on the left representing the acid isoforms, and two peaks to the right that correspond to the basic isoforms.

The first peak corresponding to the acid isoforms eluted between 14.33 and 14.57 minutes and represented 12.76% to 20.99% of the area under the curve. The main peak of neutral isoforms represented 53.51% to 58.30% of the isoforms and eluted between 15.61 and 15.91 minutes.

The greatest differences were detected for the peaks of basic isoforms. The first peak eluted between 17.21 and 17.43 minutes and ranged between 0.28% and 3.33% of isoforms detected for all conditions except for condition 10, which represented 11.37% of isoforms detected. The last peak eluted between 20.64 and 20.89 minutes and represented ranges of isoforms detected between 0.03% and 0.28% for most samples; the exception was condition 10, in which the latest peaks represented 14.54% of the isoforms detected. The test showed resolution and reproducibility in the retention times of the peaks because the coefficient of variation ranged between 0.29% and 0.76%.

The presence of lower levels of basic variants has already been reported when comparing biosimilar antibodies such as adalimumab with its original reference product.15 These basic peaks have been related to the presence of one or two lysines at the C-terminal end of the antibodies, and their absence may be due to a higher activity of a carboxypeptidase enzyme.16

CD Spectroscopy

CD spectroscopy is a suitable method to quickly determine the type of secondary structure of proteins, and the analysis of a protein’s spectra in the far UV directly reveals information about its structural classification.17 The secondary structure of the eight evaluated conditions of biosimilar antibody was determined from the analysis of the far-UV-CD spectra (Figure 7). As differences in intensity were observed, probably due to an influence of protein concentration, data were transformed using a scale factor18 and all IgG were shown to overlap indistinguishably.

Spectra were similar in terms of the wavelengths of the positive and negative bands and in the wavelength at zero intensity; they evidenced proteins with a high content of beta sheets, with a positive band around 202 nm and a negative band at approximately 217 nm.19


  • 15Liu, J., T. Eris, C. Li, S. Cao, and S. Kuhns. “Assessing Analytical Similarity of Proposed Amgen Biosimilar ABP 501 to Adalimumab.” BioDrugs 30, no. 4 (2016): 321–338. doi:10.1007/s40259-016-0184-3
  • 16Luo, J., J. Zhang, D. Ren, W. L. Tsai, F. Li, A. Amanullah, and T. Hudson. “Probing of C-Terminal Lysine Variation in a Recombinant Monoclonal Antibody Production Using Chinese Hamster Ovary Cells with Chemically Defined Media.” Biotechnology and Bioengineering 109, no. 9 (2012): 2306–2315. doi:10.1002/bit.24510
  • 17Siligardi, G., R. H. Patching, and M. K. Phillips-Jones. “Ligand-and Drug-Binding Studies of Membrane Proteins Revealed Through Circular Dichroism Spectroscopy.” Biochimica et Biophysica Acta 1838 (2014): 34–42. doi:10.1016/j.bbamem.2013.06.019
  • 18Klose, D. P., B. A. Wallace, and R. W. Janes. “DichroMatch: A Website for Similarity Searching of Circular Dichroism Spectra.” Nucleic Acids Research 40 (2012): 547–552. doi:10.1093/nar/gks449
  • 19Hong, J., Y. Lee, C. Lee, S. Eo, S. Kim, N. Lee, Y. Lee. “Physicochemical and Biological Characterization of SB2, a Biosimilar of Remicade®(Infliximab).” MAbs 9, no. 2 (2017): 365–383.
Figure 7: CD analysis of mAb samples

Figure 8: Comparison of intrinsic fluorescence spectra of mAb samples.

Information about the tertiary structure conformational characteristics of the proteins was determined by emission of fluorescence in the range of 300–450 nm, after the selective excitation of the Trp at 295 nm. Figure 8 shows the fluorescence spectra expressed in fluorescence intensity in arbitrary units (u.a.) versus length of wave (nm).

The eight evaluated conditions were also similar in terms of their maximum fluorescence emission of Trp, at approximately 340 nm, which corresponds to the maximum described in the literature for antibodies.20 The results obtained suggest that the secondary structure and conformational features of the tertiary structure determined by CD and FL of the batches evaluated are similar.

Determination of Binding Affinity to the Ligand

The biological activity of therapeutic antibodies is manifested when they bind to a specific ligand. In this study, the comparison of binding affinity of the purified antibody preparations was performed in a recognition ELISA to determine the binding specificity21 prior to in vitro neutralization assays using cellular models.

The results obtained indicate that the intensity of ligand binding is dependent on the dose of antibody used (Figure 9), obtaining 100% binding at concentrations of approximately 1,000 ng/mL, and practically no signal exists for concentrations less than 1 ng/mL. This sigmoidal behavior in the studied work range allows the calculation of the EC50 (effective mean dose) as a quantitative parameter to compare the affinity of the molecule for its ligand in the different preparations.22

The statistical comparison of the EC50 obtained for the different preparations obtained shows significant differences determined by the temperature variation (P = 0.0055), and the interaction between the agitation and the airflow (P = 0.0099).

Definition of Critical Process Parameters

Monoclonal antibody products are inherently heterogeneous because of posttranslation modification that often occurs during the fermentation process. The quality evaluation of the molecule obtained in the different fermentation conditions clearly showed that variations on airflow (P = 0.0045) and interaction between culture media and airflow (P = 0.0056) induced differences in the intensity of the different molecular variants in SDS-PAGE. The high-er amounts of H2L2 (complete antibody) were obtained in CMF independently of airflow changes; also, in mixtures with proprietary media formulation, the amounts of H2L and HL variants increased. This could be related to antibody disulfide bond fragmentation related to the presence of free thiols in the supernatant because of diminished concentrations on media mixture of reduction inhibitors for the enzymes involved in the pathway.23  Diminished airflow also promotes antibody reduction because it maintains a more stable oxygen delivery level, as previously reported.24

Our study also pointed out that variations on airflow (P = 0.0280) and temperature (P = 0.0162) influenced distribution of isoforms in isoelectric focusing (data not shown). The increase of both airflow and temperature was related to the apparition of bands of lower isoelectric point; this finding is consistent with reports that demonstrated higher temperature led to a higher level of acidic variant because deamidation or glycation25 with the low levels of basic isoforms, detected on WCE chromatograms. The increase in airflow ensures increased oxygen delivery levels, which could lead to an increase on oxidized variants as acidic species because of the generation of negative charges by the Asn (glycans) cleavage to Asp (carboxylic acid).


  • 20Ghisaidoobe, A. B. T., and S. J. Chung. “Intrinsic Tryptophan Fluorescence in the Detection and Analysis of Proteins: A Focus on Förster Resonance Energy Transfer Techniques.” International Journal of Molecular Sciences 15, no. 12 (2014): 22518–22538
  • 21Bhol, K. C., D. E. Tracey, B. R. Lemos, G. D. Lyng, E. C. Erlich, D. M. Keane, and B. S. Fox. “AVX-470: A Novel Oral Anti-TNF Antibody with Therapeutic Potential in Inflammatory Bowel Disease.” Inflammatory Bowel Diseases 19, no. 11 (2013): 2273–2281. doi:10.1097/MIB.0b013e3182a11958
  • 22Meager, A. “Measurement of Cytokines by Bioassays: Theory and Application.” Methods 38, no. 4 (2006): 237–252.
  • 23Ruaudel, J., M. Bertschinger, S. Letestu, R. Giovannini, P. Wassmann, and P. Moretti. “Antibody Disulfide Bond Reduction During Process Development: Insights Using a Scale-Down Model Process.” BMC Proceedings 9, Suppl. 9 (2015): 24. doi:10.1186/1753-6561-9-S9-P24
  • 24Trexler-Schmidt, M., S. Sargis, J. Chiu, S. Sze-Khoo, M. Mun Y. H. Kao, and M. W. Laird. “Identification and Prevention of Antibody Disulfide Bond Reduction During Cell Culture Manufacturing.” Biotechnology and Bioengineering 106, no. 3 (2010): 452–461. doi:10.1002/bit.22699
  • 25Zhang, X., Y. T. Sun, H. Tang, L. Fan, D. Hu, J. Liu, and W. S. Tan. “Culture Temperature Modulates Monoclonal Antibody Charge Variation Distribution in Chinese Hamster Ovary Cell Cultures.” Biotechnology Letters 37, no. 11 (2015): 2151–2157. doi:10.1007/s10529-015-1904-3
Figure 9: The dose-dependent response of the affinity of the antibody obtained under different fermentation conditions.

Our study also showed significant differences in antigen-binding affinity assays, where EC50 of conditions 2, 3, and 7 were 51%–55% higher than the control; therefore, it is possible that product microheterogeneity could potentially generate product variants with decreased functionality. None of the studied parameters was related to biological recognition, so it is possible that potential variations in glycosylation pattern were responsible for antigen-binding affinity modifications. Monoclonal antibody glycosylation is mainly induced by process chemical stress parameters26 However, further study analyzing potential causes for the differences in the antigen-binding affinity should be developed.

The intensity of ligand binding is dependent on the dose of antibody used.

Optimal conditions were determined for fermentation operation based on the equations obtained using the numerical optimization function of De-sign-Expert 6.0.1 software. In this context, we assumed that the purified mAb should have more than 95% purity in the H2L2 band in SDS-PAGE, less than 1% aggregation determined by gel filtration HPLC, five peaks in weak cation exchange, and the lowest EC50 dose for ligand binding. As a result, it was determined that in the fermentation process, any of the two culture media could be used. Stirring can be moved in a range between 0.8 and 1 m/s tip speed (between 330 and 450 rpm in the 2-L system); airflow should range between 0.008 and 0.015 vvm, and the temperature should be between 34.04°C and 36.87°C. These results partially coincided with the results of the fermentation process optimization based only on the kinetic parameters of the culture, in which the same ranges of airflow velocity and impeller tip speed were defined, but with a narrower temperature window of between 35.6°C and 36.5°C.

Conclusion

Results of this study indicated fractional factorial designs as useful tools for minimizing the number of runs required in the initial screening of potentially influential process parameters of stirred tank fermentation in perfusion. Airflow temperature and agitation speed are key parameters for the good performance of this fermentation process.

Temperature, stirring speed, and airflow were defined as critical operational parameters based on their effects on quality profiles of a therapeutic mAb. Preparations obtained under different fermentation conditions showed differences in purity, whereas the H2L2 molecule ranged from more than 97.52% purity in conditions 2, 3, and 4 to between 78.55% and 92.11% in the other experimental assays. An increase of more than 10% in the amount of basic isoforms was also detected in one of the experimental conditions assayed, and binding affinity to the ligand was more than 50% lower than the control in three conditions.

The statistical model derived from fractional factorial design predicted that in fermentation process scale-up, the operational and design space in terms of stirring and airflow would be the same, but variations in the temperature outside the narrow operational range from 35.6°C to 36.5°C could compromise process yield; however, they would not adversely affect the required quality specifications.

  • 26Ivarsson, M., T. K. Villige, M. Morbidelli, and M. Soos. “Evaluating the Impact of Cell Culture Process Parameters on Monoclonal Antibody N-Glycosylation.” Journal of Biotechnology 188 (2014): 88–96. doi:10.1016/j.jbiotec.2014.08.026