Role of Process Capability in Monitoring Product Quality

ASTM defines process capability as the natural or inherent behavior of a stable process that is in a state of statistical control, which is achieved when the process exhibits no detectable patterns or trends (ASTM E2281). Statistical tools, such as control charts, are utilized in the determination of process capability, and capability indices are commonly reported. Conceptually, these indices are the ratio of the range of the tolerance defined by its specifications compared to the range occupied by the inherent variability of the process. Process capability is not a regulatory requirement, but it is a supporting tool that helps organizations understand how a particular process is behaving and, therefore, may be used to support product quality.
1 Introduction
ASTM defines process capability as the natural or inherent behavior of a stable process that is in a state of statistical control, which is achieved when the process exhibits no detectable patterns or trends (ASTM E2281 1). Statistical tools, such as control charts, are utilized in the determination of process capability, and capability indices are commonly reported. Conceptually, these indices are the ratio of the range of the tolerance defined by its specifications compared to the range occupied by the inherent variability of the process. Process capability is not a regulatory requirement, but it is a supporting tool that helps organizations understand how a particular process is behaving and, therefore, may be used to support product quality. For example, maximizing this ratio reduces risk to the patient, reduces the risk of drug shortages, and enables companies to provide products more reliably to patients around the world. Improving capability requires prioritization and a comprehensive understanding of the most important sources of variability in the process, excipients, raw materials, components, equipment, and supply chain. Through understanding of this variability, action plans aimed at controlling and reducing variability can be implemented. This concept paper explores key considerations and challenges associated with implementation of process capability indices within the pharmaceutical industry.
Statistical Process Control (SPC) is more than control charts alone; it is a comprehensive set of tools that can be used to:
- Understand the process
- Understand the causes of variation
- Eliminate the sources of variation
These tools include histograms, control charts, pareto analysis, cause and effect diagrams, check sheets, scatter plots, and stratification, referred to as quality leader Kaoru Ishikawa’s “magnificent seven.”
The relevance of this to the pharmaceutical industry can be seen in the US FDA Guidance for Industry on Process Validation (2011) 2, which highlights that manufacturers should:
- Understand the sources of variation
- Detect the presence and degree of variation
- Understand the impact of variation on the process and, ultimately, on product attributes
- Control variation in a manner commensurate with the risk it represents to the process/product
Statistical process control has been widely utilized across manufacturing industries for decades. The automotive industry has leveraged such analyses since the 1980s, using SPC to prevent nonconforming product, support continuous improvement initiatives, and communicate areas of risk across the supply chain (Kane, 1986 3). Likewise, environmental protection has implemented these analysis tools in the quantitative evaluation of environmental performance of a plant with respect to prevailing regulations (Kahraman, 20094; Corbett, 2002 5). Industries involved in machining and precision tooling require such statistical analysis methods in order to assure machine tool/process stability and enable the manufacture of highly precise components (Motorcu, 2006 6). The nuclear industry has applied statistical control methods to evaluate material balances through their facilities. This is done in order to detect losses and mitigate risks (Prasad, 1999 7). Other examples are highlighted in Table 1.1.
| Industry | Application | Example References |
|---|---|---|
| Automotive |
| Kane, 1986 3 |
| Environment/Pollution |
| Kahraman, 2009 4; Corbett, 2002 5 |
| Mineral Processing |
| Ipek, 1999 8 |
| Soap Manufacturing |
| Basu, 2014 9 |
| Machining/Precision Tooling |
| Motorcu, 20066 |
| Optical Fiber Networks |
| Lin, 201210 |
| Analytical Methods |
| Bouabidi, 2012 11 |
| Contact Lens Manufacturing |
| Young, 1999 12 |
| Nuclear |
| Prasad, 1999 7 |
In the pharmaceutical industry, the code of federal regulations makes numerous references to expectations on process monitoring and control. 21 CFR Part 211.110 13 indicates that “to assure batch uniformity and integrity of drug products, written procedures shall be established and followed that describe the in-process controls and tests or examinations to be conducted on appropriate samples of in-process materials of each batch. Such control procedures shall be established to monitor the output and to validate the performance of those manufacturing processes that may be responsible for causing variability in the characteristics of in-process material and the drug product.” 21 CFR Part 211.165 14 highlights that “acceptance criteria for the sampling and testing conducted by the quality control unit shall be adequate to assure that batches of drug products meet each appropriate specification and appropriate statistical quality control criteria as a condition for their approval and release. The statistical quality control criteria shall include appropriate acceptance levels and/or appropriate rejection levels.”
Medical device regulations provide similar attention to monitoring/control. 21 CFR Part 820.75 15 suggests that “each manufacturer shall establish and maintain procedures for monitoring and control of process parameters for validated processes to ensure that the specified requirements continue to be met. (1) Each manufacturer shall ensure that validated processes are performed by qualified individual(s). (2) For validated processes, the monitoring and control methods and data, the date performed, and where appropriate, the individual(s) performing the process or the major equipment used shall be documented.” 21 CFR Part 820.250 16 goes on to mention that “where appropriate, each manufacturer shall establish and maintain procedures for identifying valid statistical techniques required for establishing, controlling, and verifying the acceptability of process capability and product characteristics. Sampling plans, when used, shall be written and based on valid statistical rationale.”
Given the requirements already observed in the federal regulations, as well as the demonstrated utility of the approach across multiple industries, achieving product robustness through process monitoring (with control charts and capability indices) should be encouraged in the pharmaceutical industry. Yu recently made a similar recommendation, highlighting that capability indices can be a powerful tool from product design through commercial manufacturing. Particularly, capability indices are helpful in understanding more about a product or process, linking critical material attributes to Critical Process Parameters (CPPs)/Critical Quality Attributes (CQAs), and establishing a control strategy (Yu, 2015 17). This concept paper puts forward the following recommendations for the application of process capability tools for process monitoring in pharmaceutical manufacturing. A process capability assessment is most effective for improving quality and ensuring reliable supply when used as:
- A self-audit of process performance for the setting of business priorities
- A means to identify potential risks to a CQA within a process based on monitoring by experts with relevant experience or training
- With harmonized tool(s) and reported consistently across sites/company
- With easy and meaningful metrics to capture and report
- A mechanism to support acceptable, not unwanted behaviors (i.e., a company culture of continuous improvement)
2 Ways to Measure Capability
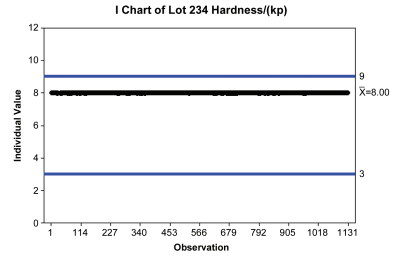
Compliance and performance of a process can be interpreted from the same data set, but from very different perspectives with different implications. For example, Figure 2.1 shows a series of tablet hardness measurements plotted against their specifications in blue (from 3 to 9 kp) and centered on 8 kp. Because this is plotted against accept/reject specifications, this data can be interpreted from a compliance perspective. This perspective is focused on verifying that a process is meeting clinically relevant specifications, ultimately ensuring no impact to patient safety.
Figure 2.1: Tablet Hardness Data – A Compliance View of Tablet Press Performance Against Specifications
However, if the same data set is reevaluated based on statistical trend limits (7.998 to 8.012 in red) as shown in Figure 2.2, the picture changes. This tablet press is shown to be highly variable.
Figure 2.2: Tablet Hardness Data – A Performance View of Tablet Press Performance Against Control Limits
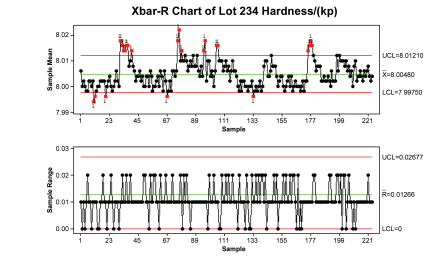
Capability is both a matter of perspective and purpose, and is dependent upon how it is defined. Figures 2.1 and 2.2 depict the same data; however, the performance model is meant to proactively show potential problems. Manufacturing with a continuous improvement mindset is always actively searching for potential risks. Failure to control a process at the “performance level” may lead to failure at the “compliance level.” Both perspectives are necessary to control and manage a process.
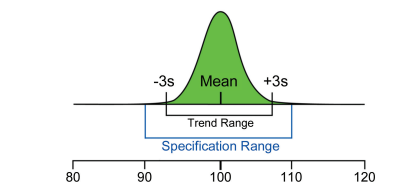
Figure 2.3 shows the range of process variability relative to specifications for a hypothetical example. The compliance view of variability is defined by the specification range, whereas the theoretical process variability is defined by the statistical trend range (often set at +/- 3 s).
Figure 2.3: Performance and Compliance Views of Process Control
Many approaches to measuring process capability exist. Where some focus on nonconformance—or probability of an Out Of Specification (OOS) — others focus on what proportion conforms to specifications. Common and simple measures of process performance are the capability indices, which compares the process variability to the range allowed by specifications.
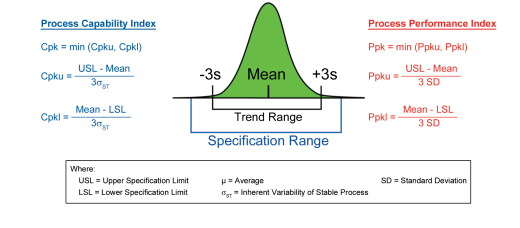
Early commentary on process capability defined the concept as an evaluation of “the natural or undisturbed performance (of a process) after extraneous influences are eliminated” (Small, 1956 18). Others have defined capability as the natural or inherent behavior of a stable process that is in a state of statistical control (ASTM E2281 1). From a practical perspective, these simple statistical tools allow for an evaluation of the degree of risk a particular parameter or attribute is posing to a patient, process, or facility for the purpose of ranking priorities for continuous improvement. The simplest of the capability indices are Cp (Process Capability Index) and Pp (Process Performance Index); these ignore the centering of process results within the specification range. If process centering is important (and in most cases, it is), Cpk or Ppk are more useful indices. The two metrics represent different views of process capability. Cpk estimates the best-case performance theoretically achievable by the process. When dealing with data from a stable process (evidenced by inherent variability with no sources of intermittent variation), process capability indices (Cpk) can be used. Ppk is indicative of actual or current performance, reflecting the impact of both common and special causes. For a process not yet demonstrated to be stable, process performance indices (Ppk) should be utilized instead of Cpk. Figure 2.4 summarizes the two indices and associated calculations. However, it is important to note that any measurement comparing the variability of a process to its specifications is an acceptable and powerful tool.
Figure 2.4: Process Capability and Performance Indices
3 How are product robustness and process capability linked?
Product robustness is defined as the certainty and ability to prove that any product, at any time in any place, from any site or allied manufacturer, is of expected quality and available when/where it is intended. As outlined by Bika (Bika, 201519), the four functional areas essential to building robustness include supplier, equipment, process, and distribution, with key enablers related to people, business processes, and technology. End-to-end considerations from raw materials to packaging and distribution allow teams to identify all sources of variability and create targeted actions for areas with frequent or repeat issues. A robust product consistently meets specifications and is fully compliant with GMP expectations. Discards and recalls are eliminated, patients are able to reliably receive product. Included in this ideal is successful product design that can withstand manufacturing and distribution conditions.
A robust process demonstrates acceptable quality and performance while tolerating input variability. A key element of this is applying simple statistical tools such as process capability indices, where variation and risk can be detected and actions can be taken. Such tools can be used to monitor performance across a large portfolio in a concise manner and focus attention to areas in need of improvement. Highly variable attributes (or attributes with low capability indices) are more likely to result in product discard.
In January 2011, the FDA issued a Guidance for Industry on “Process Validation: General Principles and Practices” 2 which describes a life cycle approach to Process Validation (PV) including process design, process qualification and performance qualification, and continued process verification. Similarly, the “EU Guidelines for Good Manufacturing Practice for Medicinal Products for Human and Veterinary Use, Annex 15: Qualification and Validation” 20 discusses these topics. Process robustness monitoring is part of this philosophy, and is undertaken to assure that the routine manufacturing process remains in a state of control. Monitoring includes process inputs, design, control strategy, and outputs to identify key elements which may contribute to variability or process shifts. The most simple and effective way to perform such monitoring is to utilize control charts.
Such review of key attributes can be accomplished through tracking and trending data in control charts (evaluating a +/- 3 standard deviation range). Confidence intervals can be applied to capability index calculations to reflect the degree of uncertainty with limited batches. Periodic data reviews by technical subject matter experts will allow for proactive assessment of statistical outliers and prevent future quality events/investigations. For new products, data may be limited, underscoring the particular importance of detailed understanding of special cause variation prior to taking any action.
In the framework of SPC, the purpose of control chart monitoring is to identify special causes of variation, rapidly. These are distinguished from common causes of variation, because the type of action required to reduce special causes of variation is totally different from the action required to reduce common cause variation. Special causes of variation are addressed by searching for the cause immediately, before the trail grows cold. Control charts enable rapid identification of special cause variation to support their elimination from the process. When the overall level of common cause variation is unacceptably high, fundamental improvements such as changes to the process design and control strategy are required.
4 Establishing a Monitoring Plan
In order to evaluate sources of variability in a given process, capability indices should be calculated for selected parameters/attributes and a process monitoring plan should be developed. A process monitoring plan is a list of process parameters that are specific, measureable, controllable, and a driver of the CQAs or release attributes. They can include CPPs, In-Process Controls (IPC), quality control test alert or a physical characteristic; however, this list is not exhaustive. They may also be business drivers including cycle time and yield. The objectives of a monitoring plan are to:
- Evaluate the impact of variability in process inputs such as materials, facility and equipment
- Control variability
- Prioritize resources to minimize risk to the patient
Key elements should include:
- Known robustness/performance issues with manufacturing process and analytical methods
- Outputs from Quality Risk Assessments (QRAs)
- Highlight performance issues during development and scale-up campaigns
- Overview of Annual Product Quality Review findings and action plans
- Development and technology transfer history
Additionally, a review of CQAs, CPPs, Critical Material Attributes (CMAs), Key Process Parameters (KPPs), and other Critical to Quality Parameters identified through a risk assessment should be performed. This analysis should include:
- Control charts
- Capability analyses; Cpk, Ppk values below a predetermined value based upon the level of risk a company is able to take on for a particular parameter or attribute should be evaluated and a plan of improvement established
- For new products, data may be limited; therefore, special cause variation should particularly be highlighted so that risks are clear prior to taking action. As this variation may be new to the product/process, detailed understanding is needed.
- Review of stability data trends for Drug Substance (DS) and Drug Product (DP)
- Trend of performance metrics such as:
- Number of batches manufactured versus rejected
- Complaints (use Pareto analysis as appropriate)
- Recalls
- Number of batches falling outside of control limits
- Analytical robustness (variability or bias issues, sampling concerns)
- Review of excipient and DS properties (e.g., flow, specific surface area, particle size, morphology, bulk density)
Monitoring plans should be periodically reevaluated as new data sets are generated and/or process or product trends are observed. For example, annual reevaluation, or an analysis after 30 lots, allows for identification of any new sources of variability or process shifts. New parameters may be identified for future monitoring. Parameters shown to be in a state of control could be eliminated. A risk based approach can be applied to efficiently identify the right parameters for evaluation.
Ultimately, the establishment of a robust process includes a monitoring plan, comprehensive understanding of a product’s history, risk areas, and inputs, and an analysis of control charts as well as capability indices for critical attributes/parameters.
5 Using Process Capability for Continual Improvement as Internal Audits and Compliance Assessments
As outlined in Yu et al., 2014 21] there are numerous applications of process capability and performance indices throughout the product life cycle, from product design through scale-up/qualification to commercial manufacturing. The type of statistical calculation and nature of its interpretation may change based on the stage in life cycle. An example of how such indices may be utilized is shown in Table 5.1.
| Lifecycle Stage | Ppk vs. Cpk | Application |
|---|---|---|
| Product Design | Ppk | Identification of sources of variability, critical parameters/attributes; Use in establishing control strategy |
| Process Scale-up and Qualification | Ppk | Same as above + Process Validation Approach |
| Commercial Manufacturing | Ppk or Cpk | Same as above + On-Going Continual Improvement |
ICH Q10 22 characterizes the goal of technology transfer activities as a transfer of product/process knowledge that forms the basis for the manufacturing process, control strategy, process validation approach, and ongoing continual improvement. Performing capability/performance index calculations fulfills the spirit of this goal, and supports the establishment of a robust manufacturing process. PpK indices provide a more realistic estimate of variability, with CpK providing a more optimistic, theoretical estimate (with no sources of intermittent variation). Both are useful tools to evaluate broadly across a portfolio or across many attributes. However, performance trends should first be evaluated using control charts, as they are far more sensitive to enable detection of issues. Indices can be used to summarize performance over a window of time, collapsed across different manufacturing sites/quality attributes for comparison purposes.
The question of whether or not such indices should play a role as a compliance tool has been actively discussed in the ISPE community. The primary stage in a product life cycle where this could take place is during the commercial manufacturing stage. Product specifications have been set on development and clinical data (e.g. efficacy and safety), which is of the utmost importance from a compliance perspective. Per ICH Q10 22, “the goals of manufacturing activities include achieving product realization, establishing and maintaining a state of control, and facilitating continual improvement.” The pharmaceutical quality system should assure that the desired product quality is routinely met, suitable process performance is achieved, the set of controls are appropriate, improvement opportunities are identified and evaluated, and the body of knowledge is continually expanded.”
Continuous improvement is an expectation throughout industry, and is made easier through the use of simple statistical tools such as capability/performance indices, enabling evaluation of performance across multiple products to enable corrective actions to be taken. However, these indices are not the definitive answer as to the state of a company’s control of a particular product or process. As highlighted in Section 3, process robustness (of which capability/performance indices play an essential role in) is just one element of an overall product robustness strategy that encompasses supplier, equipment, and distribution functional areas as well, in addition to key enablers such as people, business processes, and technology.
The goal of developing a robust process is linked to understanding and continual improvement, driven through internal reviews and audits (leveraging tools such as capability indices). The very nature of internal audits is believed to be excluded from the scrutiny of regulatory inspections, as noted in the US FDA’s Compliance Policy Guide (CPG 7151.02) 23, FDA Access to Results of Quality Assurance Program Audits and Inspections, Sec. 130.300. Even though FDASIA section 706 gives the agency access to “Any records or other information that the Secretary may inspect under this section,” this does not change the designation of internal audit data as not inspectable under normal circumstances. The delineation between internal audit data and compliance metrics is important in-so-much as this distinction is critical in assuring proper collection and use of this process information by the manufacturer. Given this perspective, further clarification on the use of internal audits by health authorities would be helpful for industry as robustness monitoring plans mature. Capability indices, when leveraged in a continuous improvement environment, identify products and process that may need remediation, while still reliably supplying product to the market. Creating capability indices as reportable metrics could be counterproductive to this effort. Companies should be encouraged to maintain a quality culture that demands continual improvement, driven by patient needs and not by compliance requirements.
It is important to note that many specifications in biopharmaceutical manufacturing are derived from actual process data, especially when unit operations are not considered “well characterized.” However, this reliance on process data can be replaced as additional manufacturing, safety, and clinical data becomes available. As specifications are developed, clinical relevance and meeting patient safety/efficacy requirements must remain the highest priority. Process monitoring and continual improvement should be leveraged to ensure a robust process, and clinical data should continue to be utilized to establish specifications.
6 Challenges and Limitations of Capability Indices in Pharmaceutical Manufacturing
Process capability informs as to the level of risk a particular attribute or parameter poses to a process routinely meeting specifications. Other quality metrics to routinely monitor that have also been discussed in the community include:
- Batch Failure Rate
- Right First Time Rate
- Confirmed OOS Rate
Each metric has a place in furthering the objective of establishing a highly capable and robust process. However, each company has a different definition of what the appropriate metric should be given the level of risk they are willing to take for a specific attribute or parameter. Establishing a generic Cpk requirement may not be directly applicable to all products and processes. For example, certain parameters may have specifications based off of compendial requirements or clinical experience. Requiring variation from specification to be within a pre-set number of standard deviations may not be feasible in these instances, and could limit release of product to the market if mandated. Continuous improvement opportunities, however, can try over time to address these areas of risk, which ultimately leads to regulatory compliance. Regardless of the tool used, industry is encouraged to leverage all statistical analyses available to understand risks and proactively remediate. With this approach, drug shortages may continue to be averted. Additionally, harmonization between regulatory bodies to have a global specification for products will reduce significant burden to the industry.
7 Future Directions
Establishing process monitoring plans which incorporate an evaluation of process capability for critical parameters/attributes is an essential part of building a robust process. Process capability indices can be an extremely valuable, simple tool to help identify process improvement opportunities. However, monitoring process capability is just one piece of a company’s overall product robustness effort; therefore, it is not a definitive metric indicative of a product’s state of control.
Capability assessments are recommended as a tool to enhance efficiency and process monitoring. Smaller companies may be limited in the extent of analysis capabilities. However, the means to develop and strengthen such tools, regardless of company size or location, is essential for industry to continue to grow and avert drug shortages. As discussed, process monitoring is an essential part in identifying continuous improvement opportunities and enabling an improvement culture, which ultimately leads to regulatory compliance. Companies should be encouraged to require such programs to ensure robust processes. However, how one achieves this goal may vary and depend on the circumstances of the products/processes manufactured. This is similar to how industry approaches the topic of process validation. Process validation is a requirement, but how a company approaches and prepares can vary. While the prevalence of process monitoring/capability assessments across industry are behind CPV and other forms of monitoring/risk assessment, capability/performance indices are most meaningful as a tool to proactively identify risk of OOS results. Understanding risks enables longer term, proactive improvement, separate from an individual batch release process.
Companies should continue to be encouraged to use statistical tools in appropriate situations, as part of an overall product robustness effort. ISPE’s Quality Metrics Pilot Program 24 does include a metric for Confirmed OOS, which is a leading metric for recalls. Using a process capability index criteria as a reportable metric may have little additional value over Confirmed OOS. ISPE will continue working on developing guidance to industry regarding appropriate use of process capability measurements.
9 Acronyms
| CMA | Critical Material Attribute |
| CPP | Critical Process Parameter |
| CQA | Critical Quality Attribute |
| DP | Drug Product |
| DS | Drug Substance |
| IPC | In-Process Control |
| KPP | Key Process Parameter |
| OOS | Out Of Specification |
| PQLI® | Product Quality Lifecycle Implementation® |
| PV | Process Validation |
| QRA | Quality Risk Assessment |
| SPC | Statistical Process Control |
Limitation of Liability
In no event shall ISPE or any of its affiliates, or the officers, directors, employees, members, or agents of each of them, or the authors, be liable for any damages of any kind, including without limitation any special, incidental, indirect, or consequential damages, whether or not advised of the possibility of such damages, and on any theory of liability whatsoever, arising out of or in connection with the use of this information.
© 2017 ISPE. All rights reserved.
All rights reserved. No part of this document may be reproduced or copied in any form or by any means – graphic, electronic, or mechanical, including photocopying, taping, or information storage and retrieval systems – without written permission of ISPE.
All trademarks used are acknowledged.
Acknowledgements
This Concept Paper was written and reviewed by members of the Process Capability Team and was supported by the Product Quality Lifecycle Implementation (PQLI®) Technical Committee.
Authors
Abizer I. Harianawala, Ariad, USA
Peter G. Millili*, Bristol-Myers Squibb, USA
Julia O’Neill, Tunnell Consulting, USA
Kevin Roberson, EAG Laboratories, USA
*Please send comments to peter.millili@bms.com.