Lessons from a Cost of Goods Analysis Workshop

Advanced therapy medicinal products (ATMPs) are transformative therapeutics that are realizing increasing gains in market approvals, yet are expensive products to produce. To enable a broader application of these medicinal products in the marketplace, the cost of goods (COGs) sold should be addressed early in development with a focus on reduction of cost to the patient.
Every drug product and the manufacturing process licensed to produce that product will have to address the COGs at some point—this is an inevitable fact. To enable broad application of medicines such as ATMPs, the COGs quite often need to be reduced for accessibility by the broader global patient population.
The design of a manufacturing process for any biopharmaceutical product involves a proven methodology that includes criteria such as operating costs, capital investment costs, and manufacturing reliability and efficiency. Success is often driven not by product-specific attributes, but by a wide range of facility attributes that can often be overlooked or given less emphasis.
2024 ISPE Annual Meeting Workshop
This article is the first of a three-part series focused on defining how industry views the analysis of COGs. These articles are the result of the findings from a workshop held at the ISPE Annual Meeting & Expo in October 2024. The three articles will introduce goals and objectives of the workshop, the tools that industry uses that have significant impact of COGs related to process and facility design attributes, and the methodology that was used to produce results from three different case study examples.
The focus of the workshop was to identify key factors that could be both verifiable and easily measured for short- and long-term impact, and also to identify any variables that should be addressed to validate the conclusions that were reached. To do this requires a defined methodology that addresses criteria such as operational costs, manufacturing efficiency, capital investment, and operational risk. The key is to define a tool that will provide the necessary data to evaluate the effort and present the results in a manner that is user-friendly and accurate.
Participants were asked a key question: “Where would you think the greatest impact to reducing cost of goods would come from?” The answer would be impacted by several attributes, including the manufacturing process, where the participant was assigned within their organization, the participant’s experience, and the scale of the manufacturing platform.
Background
“The cost of any form of biologic product is weighed against its therapeutic benefit in its cost–benefit analysis. This assessment includes considering the relative costs of manufacturing. The affordability of many ATMPs such as cell therapy products (CTPs) is often driven by factors related to development, clinical manufacturing logistics, and facility optimization. Because many CTP processes are not yet considered robust due to their lack of manufacturing support data, the question around COGs sometimes is not given its appropriate emphasis during early-phase design activities.”1
A 2017 landmark study performed by the International Society for Cell & Gene Therapy accurately stated that many CTPs are developed and launched without consideration of incorporating the COGs during process development and the resulting influence of design decisions for advancing the clinical-scale manufacturing to a more commercially viable process.2 It is critical to align early-stage process development to long-term production as soon as possible in clinical development.
The design decisions made during the conceptual design of a manufacturing asset for CTPs have consequential impacts on facility capital costs and on COGs. During clinical trials, there is tremendous focus on trial costs as companies reach their phase 3 trials, which can drive reduction of investment in facilities, equipment, and development. Decisions made years before in facility design will impact these per-patient values more than many might think. Once a process has been used to manufacture clinical material, comparability studies will be needed for changes. These one-time costs frequently do not get funded because they can have a long return on investment and/or will delay commercial approval (i.e., lost opportunity cost).
Costs for raw materials, reagents, starting materials, labor, utilities, and consumables will be driven by market conditions. Very little impact can be influenced to reduce or improve market reality. But the facility attributes that impact day-to-day operational costs and manufacturing efficiency, once established, will become baseline. Speed to market, flexibility and efficiency, and regulatory qualification and compliance are affected as the decisions impacting COGs are baselined.
Implementing COGs analysis during early-phase facility planning brings value by shedding light on areas of operational cost risk, future per-patient trial costs impacted by facility attributes, and identification of options for consideration in equipment selection and facility design. By looking at COGs distribution for each clinical phase, it can easily be seen where facility design decisions have the greatest impact. The cost impacts—from personnel, materials and supplies, equipment, and facility attributes—significantly affect overall operational costs. The early-phase facility design decisions will therefore have a significant impact on COGs.
Tools
The tools required to evaluate different production scenarios are dependent on accurate data and valid assumptions that address the necessary cost model attributes. The key to success in COGs analysis is the strength of the input data. Avoiding the “garbage in, garbage out” result of improper or irrelevant data analysis is often easier said than done. Accurate data includes:
- Personnel levels
- Actual equipment costs or bid pricing, by product or case
- Energy costs based on monthly price per kilowatt-hour (kWh) billing
- Unit operation analysis of mass-balance throughput
- Consumable costs
- Facility design and construction attributes
- Environmental monitoring (EM) and manufacturing sampling frequency and costs
- Material volumes and unit costs
Factors
“Developing COGs values that are specifically driven by the attributes of the process/facility relationship will focus on a set of inputs and outputs that have a direct day-to-day impact on operational costs and manufacturing efficiency.”2
Prior to selecting or developing a COGs model, several factors must be considered. Although the general purpose of the model may be to determine COGs for one or more manufacturing scenarios, the model may look very different depending on the manufacturing process, level of detail of available cost information, and cost types to be included in the COGs.
The workshop considered only cellular products; however, a similar methodology for determining COGs could also be applied to other products such as viral vectors, monoclonal antibodies, or even small molecules. The applicability of different cost categories will depend on the manufacturing process. For example, for the manufacturing processes in the workshop, purified water and process gases were purchased in containers rather than being generated on-site. For other processes that may make significant use of stainless steel vessels and require larger quantities of water for cleaning, on-site generation may be required. The COGs model would also need to account for costs associated with the generation.
Information—such as required equipment and consumable quantities as well as the number of full-time employees needed based on patients-per-year amounts—was provided to the workshop participants. These quantities were established based on design details for actual manufacturing facility projects where production modeling was completed as part of the project work. Having this information prepared for workshop participants allowed for the COGs model to function as an accounting tool to be used for sensitivity analysis and scenario comparison. More complex COGs models developed earlier in a project may include both production modeling and cost sensitivity components.
Cost of Goods Model
The simple COGs model developed for the workshop was loosely based on an Excel model developed for assessing the cost of viral vector production in an academic environment.3 Unlike the reference academic COGs tool, the tool used for the workshop included costs and factors not considered in the academic study. These factors included energy costs for cleanroom heating, ventilation, and air conditioning (HVAC); EM costs; and facility cost depreciation.
Workshop participants were provided with the information needed for inputs to the COGs tool to assess differences in COGs associated with scale up of a cell therapy product from either an early clinical to late clinical stage or from a late clinical stage to a commercial stage. The COGs model was broken out by cost in four main areas: personnel, facility, direct materials, and equipment.
Personnel
Occupancy of a single product is based on the target production per year. The personnel category included manufacturing, nonmanufacturing, and compliance personnel. The manufacturing personnel included both supervisors and operators for various production areas. The non-manufacturing personnel category included human resources, information technology, maintenance, warehousing, and other support personnel. Compliance personnel included quality assurance, quality control, and validation. A fixed annual salary with benefits was assumed for each employee type.
Facility
The facility category included costs associated with HVAC and EM, with assumed operating costs per square foot based on the room classification. Total installed cost (TIC) for the facility building was depreciated as part of the facility cost. Maintenance and taxes were included as a percentage of the building TIC.
Direct materials
The direct materials category included process consumables, raw materials, packaging and labeling materials, cleaning supplies, and product shipping costs. The direct materials costs were assumed to scale directly with the number of patients per year within the given operating scenario (development stage and process closure type).
Equipment
The equipment list is based on targeted occupancy for each case. The equipment category captured depreciation costs for process and laboratory equipment. The COGs model also included input fields for annual service costs based on equipment type, but this input was not used in the workshop.
Case Studies
Three cases were based on actual facilities where operating companies are planning their next stage of manufacturing. The companies in cases 1 and 2 had very similar cellular products but were very different in terms of capital available and manufacturing goals. The company in case 3 had a very complex process but had similar capital and goals as the company from the first case. For all cases, the dosing was assumed to be a one-time treatment with one dose. The equipment requirements for each case support that dosing strategy.
Workshop participants were assigned to teams of four or more people to analyze one of the three case studies. Each team was randomly assigned a case study. For each of the case studies, three scenarios were presented for consideration: base, open, and closed. Each team was given COGs information for all three scenarios associated with their case study. The information included block flow diagrams (BFDs), manufacturing area layout drawings, equipment information, staffing information, and bill of materials. The teams were also given a copy of the COGs tool prepopulated with the relevant inputs for the base scenario for their case study.
Base Scenario
The base scenario is the starting point representing a clinical development stage. It involves open operations in a biosafety cabinet (BSC).
Open Scenario
The open scenario assumes a later clinical development stage or an early commercial stage where the number of patients to be treated increases by one or more orders of magnitude over the base scenario. It uses the same open process as the base scenario, but requires additional equipment, staffing, cleanroom space, etc., to accommodate an increased patient population.
Closed Scenario
The closed scenario assumes a later clinical development stage or an early commercial stage where the number of patients to be treated increases by one or more orders of magnitude over the base scenario. The number of patients treated in the closed scenario is the same as in the open scenario. Unlike the other scenarios, the closed scenario requires a modified process to allow for closed processing. Process closure is achieved through a combination of single-use systems (SUS) and isolators.
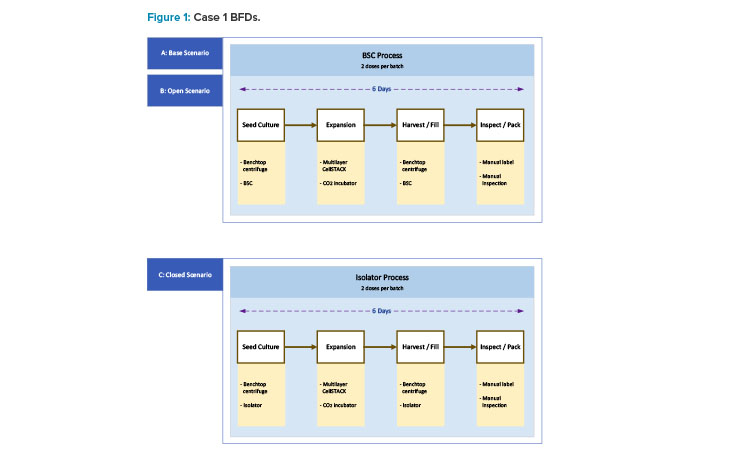
Case 1
Case 1 represents a young start-up corporate enterprise that is producing an allogeneic cell therapy product for early-stage phase 1 clinical trials. Like many start-ups, the company has limited resources in terms of financial capital, human resources, and knowledge of manufacturing operations, outside of their engagement with contracting development and manufacturing organizations (CDMOs) in the past.
Their investigative new drug has been approved for a clinical trial of 60 patients. Their process has a six-day manufacturing cycle, with a restocking of the working cell bank material after each 100 patients. The process yields two patients/batches, with a dosing requirement of one dose/patient. The current process is classified as open, implementing open BSCs as an environmental contamination risk mitigation strategy.
The BSC represents a higher-risk scenario for manufacturing unit operations compared with a closed system. The current clinical needs are moving production to supply 1,000 patients. The process for this product is a straightforward adherent cell expansion on a 2D surface, as outlined in the BFDs shown in Figure 1. The move from open to closed systems requires minimal process development mainly around consumables and working within the isolator.
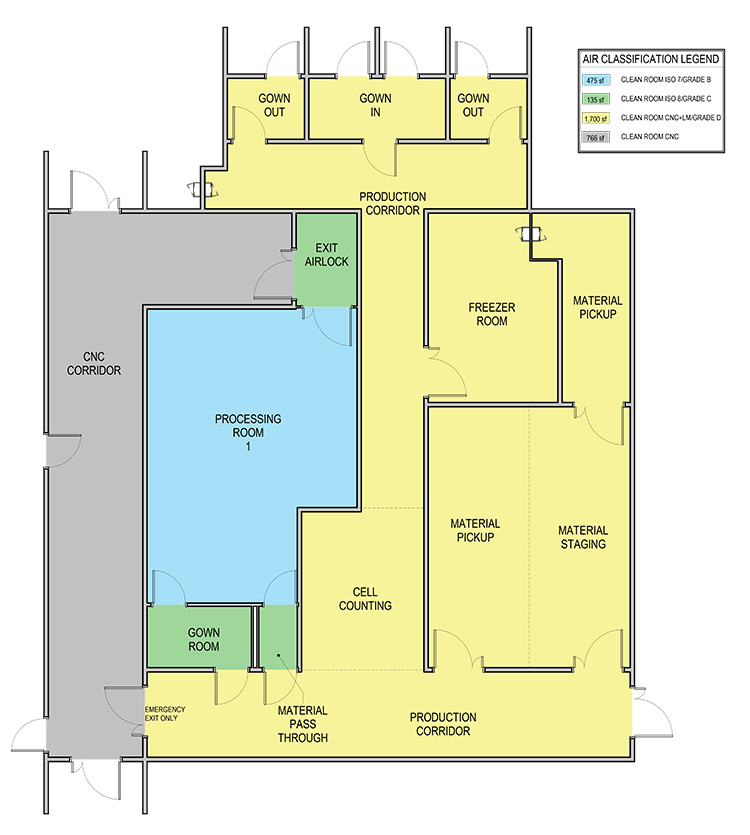
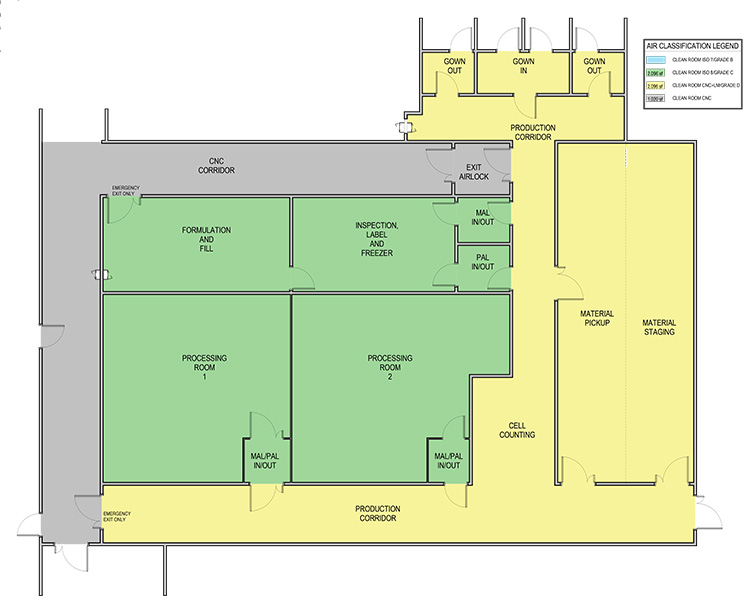
In the case 1 base scenario, limited production for phase 1 trials, the facility uses a Grade B (ISO 7 in operation) room as the background for the BSCs and lab instruments. The base scenario layout is shown in Figure 2. The open scenario adds an adjunct processing room about twice the size of the original Grade B processing space. The closed/isolated scenario adds similar room area, but both processing rooms are Grade C (ISO 8) space.
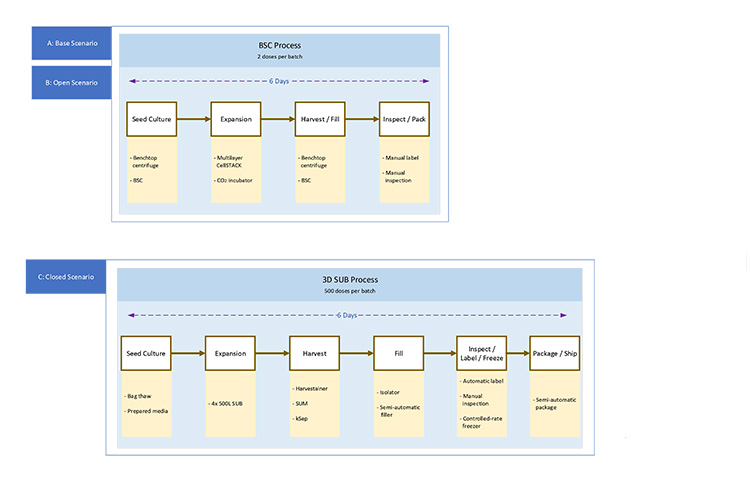
Case 2
Case 2 involves the production of an allogeneic cell therapy therapeutic by an established biopharmaceutical company. The production focus is late-stage phase 3 clinical production for a base case of 300 patients. The process provided indicates a six-day manufacturing cycle, with a restocking of the working cell bank material after every 50 production batches. The process yields two patients/batches, with a dosing requirement of one dose per patient.
In moving to commercial production, the patient population will be expanded to supply 4,000 patients/year. Expanding to commercial production may be accomplished either in the existing open process or by moving into a larger-scale bioreactor closed-system process. The bioreactor process will yield 500 patients/batches with a dosing requirement of one dose per patient. The bioreactor process will use the same cells as the 2D culture process, but will require significant process changes. The third part of the article series will cover the discussion on the risks and costs of using this approach. The BFDs for case 2 scenarios are shown in Figures 3 and 4.
Case 3
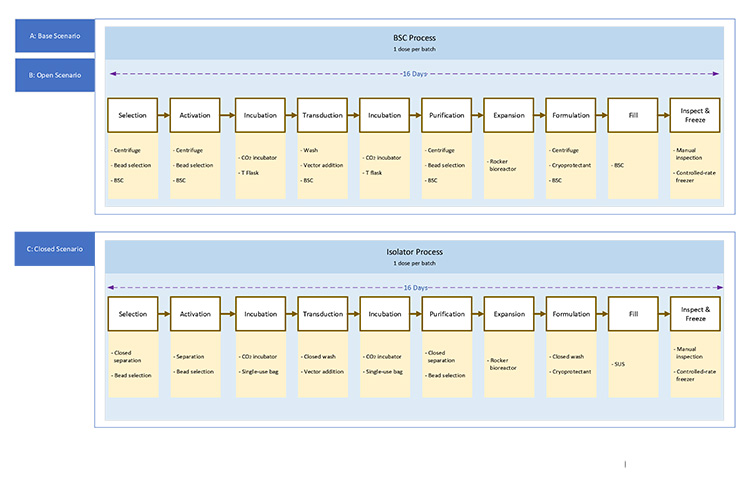
Case 3 is an chimeric antigen receptor T (CAR T) cell product being manufactured for early-stage phase 1 clinical trials by an early-stage development organization that has had successful market capitalization funding via venture capital organizations investment interest.
The phase 1 trial targeted a patient population of 54 individuals via an open manufacturing process. The target production increase must move to 2,000 patients per year. This can be achieved by implementation of expansion using BSCs or through closed processing into a single-use platform. The overall process duration is 16 days to produce the product. The BFDs for case 3 scenarios in Figure 5 show the same process steps between the open and closed process; however, most steps use different equipment. Significant process development will be needed to switch from an open to closed system.
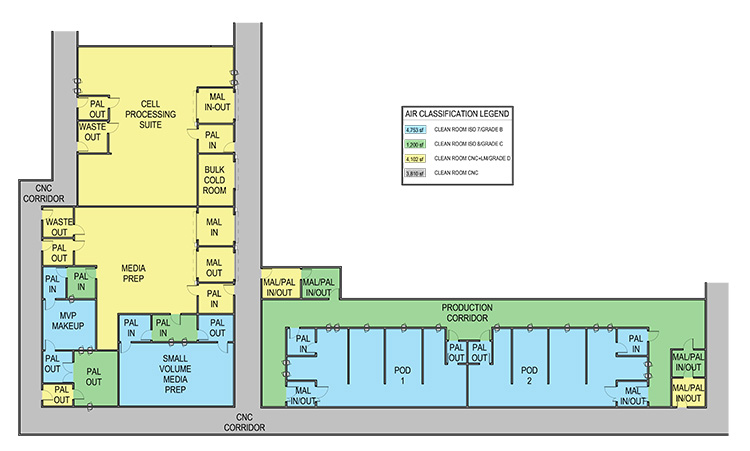
The complex process and autologous nature of this product creates a different set of layouts for case 3. The base scenario layout shown in Figure 6 shows multiple small processing cores with a centralized area for common preparations. The expanded scale open process uses the same centralized area and adds small processing rooms.
| Base Scenario (ft2) | Open Manufacturing Scenario (ft2) | Closed Manufacturing Scenario (ft2) | |||||||
|---|---|---|---|---|---|---|---|---|---|
| Case | Lab Space | Non-Lab Space | Total CNC Space | Lab Space | Non-Lab Space | Total CNC Space | Lab Space | Non-Lab Space | Total CNC Space |
| 1 | 700 | 1,300 | 2,000 | 1,200 | 5,600 | 6,800 | 1,200 | 5,200 | 6,400 |
| 2 | 1,200 | 2,900 | 4,100 | 2,200 | 23,600 | 25,800 | 800 | 9,500 | 10,300 |
| 3 | 200 | 1,600 | 1,800 | 500 | 18,800 | 19,300 | 500 | 19,600 | 20,100 |
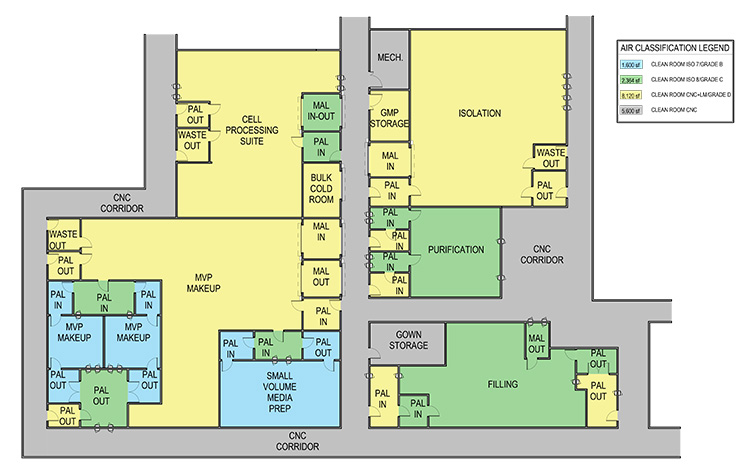
The transition from an open process to closed SUS will require some process development. In this scenario, the BioPhorum closure analysis provides a realistic expectation of that development.4 The BioPhorum analysis and actual commercial processes have not been able to determine a viable option for a fully closed process primarily due to starting materials. That development leads to a restructured layout that reduces but does not eliminate Grade B space to support formulations in Grade A (ISO 5), as shown in Figure 7.
To support the manufacturing operations, there is assumed to be a nonmanufacturing controlled not classified (CNC) support area for each layout. The support areas include labs as well as other spaces needed for employees and materials (e.g., offices, breakrooms, storage spaces, mechanical spaces) The breakdown of this space is shown in Table 1.
These cases are typical of the current industry mindset. Several people in the workshop recounted that they took part in a similar case evaluation or that they were from a company currently undergoing this evaluation to determine their path forward.
Workshop Objective
A closed system can impact multiple elements of facility design, including gowning, airlock design, layout and adjacencies, material, personnel and waste flows, manufacturing area classifications, HVAC, and critical utilities. The ISPE Baseline® Guide Vol 6: Biopharmaceutical Manufacturing Facilities (Third Edition), established how process and facility attributes can be aligned in a manner to reduce risk to patients by implementing closed-system designs.5
This workshop introduced attendees to the impacts of open vs. closed processing for cell therapy manufacturing. It featured case studies on operations in open vs. closed systems and the subsequent impact to layout, operational approach, and utility infrastructure, and how those impacted COGs. In the next article, we will discuss the key drivers for COGs optimization and how the tools identified in the session were implemented to produce the results from the workshop.
Conclusion
With the proper tools in hand, the methodology of determining COGs will be driven by the cost components previously discussed and the key performance indicators identified as critical to success. But what defines success?
The next article in this series will define the COGs analysis execution approach, the data that is required, how decision-making is performed, and the criteria that define success—cost efficiency, operational improvements, reduced waste, and inefficiency. Using the results from this workshop as a baseline, scenarios for cost reductions, facility modifications, utility optimization, and improved operations will be analyzed.
Acknowledgements
The authors would like to acknowledge the following workshop participants who will be contributors to the upcoming articles in the series: Evan Lamb, Ken Rondo, and Ryan Mazur.


