Solubility Enhancement of Ibuprofen by Porous Solid Dispersion Using a Flash Evaporation Method

The solubility behavior of drugs remains one of the most challenging aspects of formulation development and is a key determinant of a drug’s bioavailability. This article describes research aimed to improve solubility of a poorly water-soluble drug (ibuprofen) by preparing a porous solid dispersion using a flash evaporation technique.
Solubility, the phenomenon of dissolving a solute in solvent to create a homogenous system, is an important parameter to achieve the drug concentration in systemic circulation required for the desired (anticipated) pharmacological response.1 Solubility is among the most vital physicochemical properties of a drug, and the bioavailability of an orally administered drug depends primarily on its solubility in the gastrointestinal tract and its permeability across cell membranes.2 Oral ingestion is the most common and convenient route of drug delivery because it is easy to administer drugs orally and because the drugs designed for the oral route offer advantages such as stability, accurate dosage, and easy production.
Most drugs are administered in a solid form, and low aqueous solubility can either delay or limit drug absorption. Drugs that are lipophilic may fail to reach market due to their poor aqueous solubility. Enhancing solubility is therefore a major challenge in formulation development of new chemical entities, including generic drugs. Fortunately, formulation scientists can use different technological approaches to resolve this challenge.3
After screening physicochemical and biopharmaceutical properties of various drug candidates, ibuprofen was selected for the present study due to its poor bioavailability after oral administration. Ibuprofen is often administered in a solid oral dosage form with a high dose (200–800 mg). It is a Bio-pharmaceutical Classification System class II drug (aqueous solubility <0.1 mg/mL). Various techniques such as particle size reduction, crystal habit modification, complexation, solubilization, solid dispersion in carriers, and salt formation have been employed to improve the aqueous solubility of class II drugs. Solid dispersion can be achieved with spray-drying, hot-melt extrusion, supercritical fluid, and cryogenic freezing technologies. However, these technologies (especially supercritical fluid and cryogenic freezing) are limited in their ability to scale-up.4
Solid Dispersion Methods
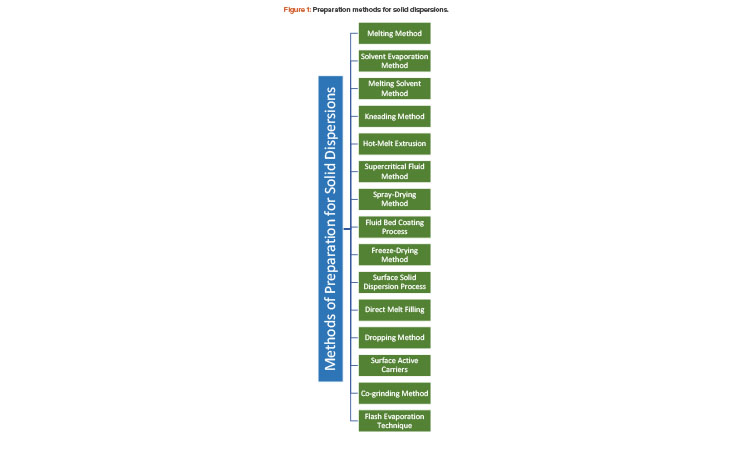
Solid dispersion is defined as the mixing of one or more active ingredients in an inert carrier or matrix at solid state. It can be prepared by the following methods (see also Figure 1):
- Hot-melt extrusion5, 6, 7
- Spray-drying8
- Fluid bed coating9
- Freeze-drying (lyophilization)10, 11
- Hot spin mixing12
- Dropping method13
- Supercritical fluid process14
- Solvent or melting-solvent method15
- Flash evaporation16
Flash Evaporation
In the flash evaporation technique, a boiling concentrated solution of the poorly water-soluble drug and a water-soluble carrier in a suitable nonaqueous solvent is subjected to sudden vacuum, resulting in flash evaporation and the formation of a porous mass that, upon grinding, yields porous granules. Adeyeye and Barabas find that this technique has more advantages than other solid-dispersion techniques.17
When a nonporous mass is brought into contact with water, only the surface portion is in direct contact with water and subject to dissolution. As one surface dissolves, another comes into contact with water, and the dissolution process continues until the entire mass dissolves.18
Dissolution Mechanism for a Nonporous Mass
Nonporous mass in contact with water → dissolution is limited to the surface → dissolution proceeds → entire mass is in solution
In contrast, dissolution of a porous mass is much faster. The pores in the mass act as capillaries due to surface force, and liquid is drawn into these capillaries spontaneously—a phenomenon called “capillarity.”
This phenomenon can be expressed by following equation:19
h=2γcos??gr
where h is the height above the liquid to which the liquid rises in a capillary, r is the radius, d is the density of the liquid, is the surface tension of water, is the angle of contact, and g is the acceleration due to gravity.
The height to which water rises in a capillary depends on the capillary radius. Employing this principle to penetration of water inside pores, the depth of penetration depends on the pore diameter. When water penetrates a porous mass, an enormous surface is in contact with water and, consequently, dissolution is expected to be rapid.
Dissolution Mechanism for a Porous Mass
Porous mass in contact with water → dissolution is not limited to the surface → dissolution proceeds (breakdown) → entire mass is in solution
Increased porosity exposes a greater surface area of the product to the dissolution fluid and encourages penetration and circulation of dissolution fluid into the mass due to capillary action.
Other research suggests that the porous solid dispersion prepared by flash evaporation technique may offer the following advantages:20, 21
- Excellent content uniformity
- Steep increase in bulk as well as porosity of the product
- Simplicity in process
- Exceptionally high dissolution rate owing to the combined effect of solid dispersion and capillary
- Option to use expensive carriers because a smaller amount of carrier is required
- Ease in converting the porous mass into granules by grinding to facilitate encapsulations, which decreases in overall product cost
- Greater product efficacy
Materials, Methods, and Findings
Materials
Polyvinyl-pyrrolidone (PVP K-30) was chosen as the carrier for the solid dispersions by flash evaporation. Following ICH guidelines for the selection of a suitable solvent for the preparation of solid dispersions, acetone was used as the solvent to prepare the solid dispersions.
We purchased ibuprofen from Helios Pharmaceutical (Baddi, India); PVP K-30 from S D Fine-Chem Limited (Mumbai, India); methanol from Merck Limited (Mumbai, India); ethanol from Rankem (Gurugram, India); ethyl acetate and acetone from Barna Chemicals (Vadodara, India); 2-propanol and 1-propanol from Triveni chemicals (Vapi, India); and potassium dihydrogen orthophosphate from Fisher Scientific (Mumbai, India). All other materials used were of analytical grade.
Preparation of Ibuprofen Solid Dispersion by Flash Evaporation
We prepared solid dispersion of ibuprofen with PVP K-30 using a 10% concentration of the drug to the total weight of the carrier. First, 400 mg of ibuprofen were placed in a round-bottom flask, and then 8 mL of acetone was added to dissolve it. Next, 4 g of PVP were added to the solution, with constant stirring, to obtain uniform distribution of the drug in the viscous solution. The viscous solution was heated until it reached its boiling point and subjected to vacuum at 760 mmHg to yield porous solid dispersion and then collected in a beaker. The resultant dry porous solid dispersion was passed through sieves no. 22 and no. 44, and granules retained on sieve no. 44 were used further to characterize and evaluate solid dispersion.
Optimization of Solid Dispersion
The following factors affecting expansion ratio, bulk density, and porosity were studied to evaluate porous solid dispersions created with the flash evaporation technique:
- Solvent volatility
- Carrier–solvent ratio
- Vacuum
- Drug–carrier ratio
Solvent Volatility
To study the effects of solvent volatility, only the polymer was used. In each test, investigators dissolved 4 g of PVP K-30 in 8 mL of a solvent and heated the solution until it boiled. The boiling concentrated solution was subjected to sudden vacuum at 760 mmHg to yield a porous mass. The bulk volume of the porous mass was noted in terms of expansion ratio and percentage porosity. The dry product obtained from the test was crushed and passed through no. 22 and no. 44 sieves. Granules retained on sieve no. 44 were used to calculate bulk density and porosity (Table 1).
| Sr. no. | Solvent | Boiling Point of Solvent (°C) |
Expansion Ratio |
Bulk Density (g/mL) |
Porosity (%) |
|---|---|---|---|---|---|
| 1 | Ethanol | 78.5 | 6:1 | 0.240 | 79.56 |
| 2 | Methanol | 64.6 | 4:1 | 0.212 | 81.21 |
| 3 | Ethyl acetate | 77.0 | 3:1 | 0.169 | 86.14 |
| 4 | Acetone | 56.2 | 8:1 | 0.142 | 89.42 |
| 5 | 2-Propanol | 82.4 | 5:1 | 0.175 | 80.75 |
| 6 | 1-Propanol | 117.6 | 5:1 | 0.249 | 78.34 |
Carrier–Solvent Ratio
To study the impact of relative proportions of carrier and solvent, 4 g of PVP K-30 were dissolved in the minimum proportion of solvent (8 mL of acetone) in a round-bottom flask. The flask was heated, and then the boiling concentrated polymer solution was subjected to sudden vacuum at 760 mmHg to yield a porous mass. The bulk volume of the porous mass was noted in terms of expansion ratio.
The resultant dry porous mass was crushed and passed through sieves no. 22 and no. 44. Granules retained on sieve no. 44 were used to determine bulk density and porosity. The same process was repeated using increasing volumes of acetone for the same quantity of PVP K-30 (Table 2).
| Sr. No. | Carrier–Solvent Ratio |
Expansion Ratio |
Bulk Density (g/mL) | Porosity (%) |
|---|---|---|---|---|
| 1 | 1:1 | 7:1 | 0.096 | 90.85 |
| 2 | 1:1.5 | 6:1 | 0.168 | 85.42 |
| 3 | 1:2 | 9:1 | 0.064 | 95.34 |
| 4 | 1:2.5 | 5:1 | 0.154 | 89.66 |
| 5 | 1:3 | 4:1 | 0.139 | 88.56 |
Vacuum
To evaluate the effects of vacuum, 4 g of PVP K-30 were dissolved in 8 mL of acetone and heated. Then, the boiling concentrated solution of PVP K-30 was subjected to sudden vacuum at 760 mmHg to yield a porous mass. The bulk volume of the porous mass was then noted in terms of expansion ratio. The resultant dry porous mass was crushed and passed through sieves no. 22 and no. 44. Granules retained on sieve no. 44 were used to determine bulk density and porosity. The same procedure was then adapted for various vacuum conditions (Table 3).
| Sr. No. | Vacuum (mmHg) | Expansion Ratio | Bulk Density (g/mL) |
Porosity (%) |
|---|---|---|---|---|
| 1 | 150 | 4:1 | 0.284 | 75.84 |
| 2 | 300 | 4:1 | 0.284 | 82.59 |
| 3 | 450 | 7:1 | 0.179 | 88.21 |
| 4 | 600 | 8:1 | 0.119 | 90.78 |
| 5 | 760 | 9:1 | 0.068 | 94.98 |
Drug–Carrier Ratio
Ibuprofen in the ratio of 2.5% (i.e., 100 mg of total weight of PVP)was placed in a round-bottom flask and dissolved in acetone using a carrier–solvent ratio of 1:2. The flask was heated, and the boiling concentrated solution was subjected to sudden vacuum at 760 mmHg to yield a porous mass. The bulk volume of the porous mass was noted in terms of expansion ratio. The resultant dry porous mass was crushed and passed through sieves no. 22 and no. 44. Granules retained on sieve no. 44 were used to determine bulk density and porosity. Additional porous solid dispersions were prepared by increasing the concentration of drug (i.e., 5%, 7.5%, 10%, 12.5% of the total weight of polymer). Bulk density and porosity of dry porous solid dispersions were determined for all products (Table 4).
| Sr. No. | Amount of Drug (%) |
Expansion Ratio | Bulk Density (g/mL) |
Porosity (%) |
|---|---|---|---|---|
| 1 | 2.5 | 3:1 | 0.114 | 83.45 |
| 2 | 5.0 | 5:1 | 0.102 | 92.58 |
| 3 | 7.5 | 6:1 | 0.095 | 93.56 |
| 4 | 10.0 | 8:1 | 0.071 | 95.78 |
| 5 | 12.5 | 6:1 | 0.101 | 91.97 |
Summary of Findings
Results shown in Tables 1–4 indicate that a higher concentration of the drug in a porous solid dispersion decreases the product’s porosity. After studying Tables 1–4, the additional following conclusions can be drawn:
- The maximum increase in bulk and porosity occurs at the boiling point of the solvent.
- A solvent with a lower boiling point (e.g., acetone) is more suitable for flash evaporation and offers a greater increase in bulk than solvents with higher boiling points.
- A carrier–solvent ratio of 1:2 offers the greatest increase in bulk and porosity.
- Porosity is directly proportional to vacuum, and maximum porosity is obtained at 760 mmHg.
- A 10% concentration of drug maximizes the bulk and porosity of the product.
In sum, the following conditions must be maintained to obtain maximum porosity in the porous solid dispersion:
- Solvent: Low boiling point (acetone)
- Temperature: Boiling point of acetone (i.e., 56.2°C)
- Vacuum: 760 mmHg
- Carrier–solvent ratio: 1:2
- Drug concentration: 10%
Characterization of Solid Dispersion
FTIR Spectroscopy
Fourier-transform infrared (FTIR) spectroscopy studies were performed to evaluate the possible interaction between the polymer and the drug. The FTIR spectroscopy of the solid dispersion spectra of the physical mixture drug with PVP K-30 was recorded for samples prepared by KBr disc method. Spectra were recorded in the 4,000 cm–1 to 400 cm–1 region22 and were clearly observed. Ibuprofen peaks were observed at 2,937.59 cm–1 corresponding to C-H stretching aromatic.
Additionally, the FTIR spectrum of ibuprofen showed that principal peaks were observed at wave numbers of 511.15/cm to 683.7/cm for aromatic C-H deformation; 772.52/cm for aromatic C-H deformation (two adjacent free Hs); 938.40/cm for aromatic C-H deformation (one adjacent free Hs); 1,074.39/cm for C-N vibration; 1,241.23/cm for C-O stretching; 1,329.00/cm for O-H bend; 1,435.09/cm for C=H deformation (CH3CH2); 1,715.74/cm for C=C stretching of α-β unsaturated ring; and 2,942.51/cm for C-H stretching.
Thermal Analysis
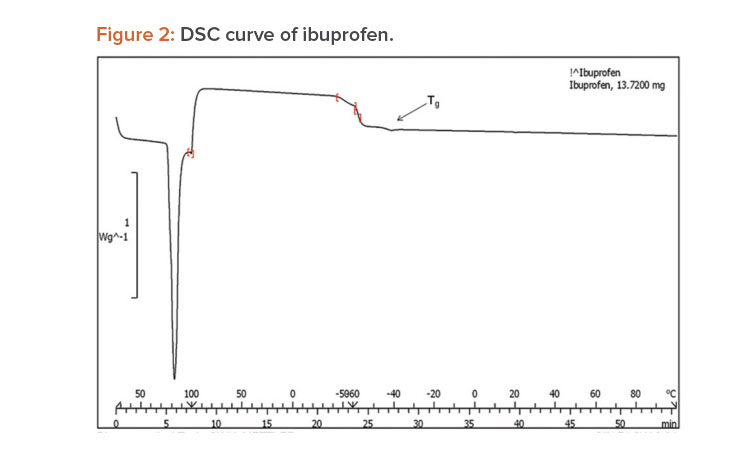
A differential scanning calorimetry (DSC) instrument was used for thermal analyses of the pure drug and a physical mixture of the drug and PVP K-30 as a solid dispersion. The sample was heated in a sealed aluminum pan at 10°C per min–1 from 0°C to 300°C.23
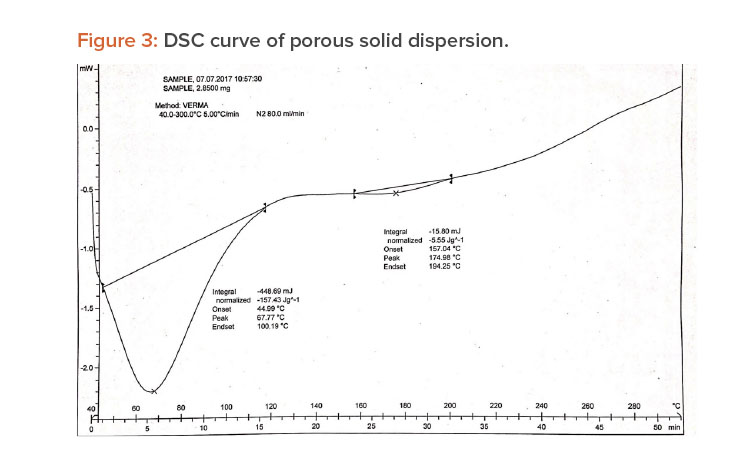
When pure ibuprofen was heated from 25°C to 100°C at 10 K/min, the DSC curve showed the melting point to be around 77.87°C (Figure 2). The DSC curve for the porous solid dispersion sample (Figure 3) showed the onset of melting temperature to be 44.99°C, and the melting endothermic peak was recorded at 67.77°C with enthalpy of fusion –157.43 J/g.
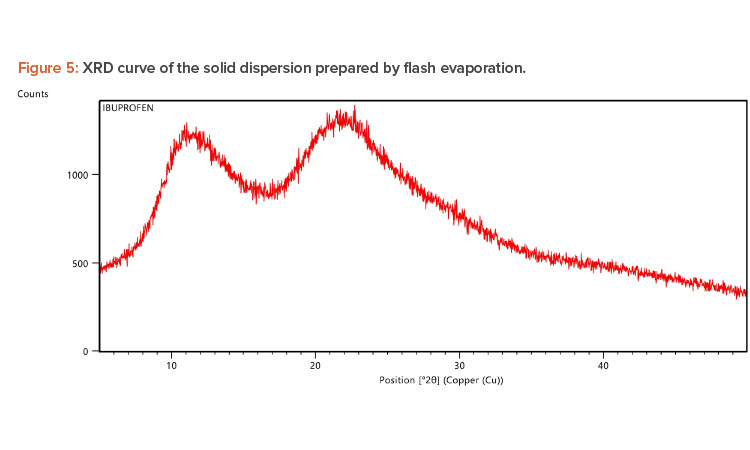
X-ray Diffraction Analysis
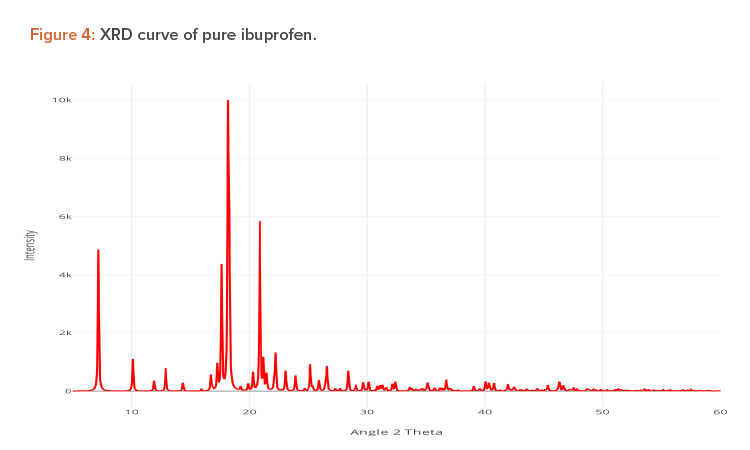
X-ray diffraction (XRD) is frequently used to examine the degree of crystallinity in a sample. We conducted an XRD study using Cu radiation filtered by Ni to characterize the physical form of ibuprofen in selected sample formulations. The samples were analyzed in the range of = 5°C–50°C. The operating conditions used were voltage 45 kV; current 40 mA; scanning speed 1/min; and temperature of acquisition at room temperature. XRD patterns of pure ibuprofen and the solid dispersion were taken.
Pure ibuprofen showed various characteristically sharp and intense peaks (Figure 4), suggesting that the drug was present as a crystalline state.24 Figure 5 shows the decrease of drug crystallinity in the solid dispersion.
In Vitro Drug Release
Accurately weighed physical mixtures of prepared formulation, each equivalent to 100 mg of ibuprofen, were added to 900 mL of dissolution medium (PBS pH 7.2) in a basket-type apparatus and stirred at a speed of 50 rpm at 37°C ± 0.5°C. Investigators withdrew 5-mL aliquots at 5, 10, 20, 30, 40, 50, and 60 minutes and replaced each aliquot with 5 mL of fresh dissolution media. The collected samples were analyzed after filtration and dilution at λmax 222 nm using an ultraviolet-visible spectroscopy spectrophotometer against the blank. Drug-release studies were carried out in triplicate. The dissolution studies of pure ibuprofen were performed in a similar fashion. The release profile data were analyzed for the cumulative percentage of drug re-leased at different time intervals.22,25
In Vitro Drug Release Kinetics
Multiple kinetic models describe the release behavior of drug from the dosage forms. Model-dependent methods are based on different mathematical functions, which describe the dissolution profile. Once a suitable function has been selected, the dissolution profiles are evaluated depending on the derived model parameters. 26 To predict the drug-release pattern of ibuprofen from solid dispersion formulations, the data were fitted to zero-order, first-order, Higuchi, and Korsmeyer–Peppas models.
Zero-Order Kinetics
Zero-order release kinetics refers to the process of constant drug release from a drug delivery device such as an oral osmotic tablet, transdermal system, matrix tablet for low-solubility drugs, or other delivery system. In its simplest form, zero-order release can be represented as follows:
Q=Q0+K0t
where Q is the amount of drug released or dissolved (assuming that release occurs rapidly after the drug dissolves), is the initial amount of drug in solution (it is usually zero), and is the zero-order release constant at time t. The graph is plotted as the percentage of cumulative drug release vs. time.
First-Order Kinetics
This model has also been used to describe absorption and/or elimination of some drugs, although it is difficult to conceptualize this mechanism theoretically. Drug release that follows first-order kinetics can be expressed by the following equation:
Qt=Q0e−kt
or
In(Qt/Q0)=K1t
where Qt is the initial amount of drug dissolved at time t, Q0 is the amount of drug in the solution, and K is the first-order release rate constant. It can be also be expressed as:
logC=logC0−Kt/2.303
where C0 is the initial concentration of drug, k is the first-order rate constant, and t is the time.26 The data obtained are plotted as log cumulative percentage of drug remaining vs. time.
Higuchi Model
In 1961, Higuchi proposed the first mathematical model to describe drug release from a matrix system.27 He was the first to derive an equation to describe drug release from an insoluble matrix as the square root of a time-dependent process based on Fickian diffusion. The following relation is used to express the Higuchi model:
Qt=Kt
where is the initial amount of drug dissolved in time and is the Higuchi release constant. The graph is plotted as the percentage of cumulative drug release vs. the square root of time.
Korsmeyer–Peppas Model
Korsmeyer derived a relationship that described drug release from a polymeric system. To identify the mechanism of drug release, drug release data were fitted in the Korsmeyer–Peppas model:
Mt/M∞=Ktn
where Mt/M∞ is the fraction of the drug released at time t, K is the rate constant, and n is the release exponent. The n value is used to characterize specific re-lease mechanisms.28, 29 The Korsmeyer–Peppas model is plotted as the log cumulative percentage of drug release vs. log time.
Findings
The regression coefficient data obtained from various release kinetics models are as follows:
- Zero-order: y = 1.281x + 28.32; R2 = 0.789
- First-order: y = 0.017x + 1.900; R2 = 0.980
- Higuchi: y = 11.73x + 9.216; R2 = 0.962
- Korsmeyer–Peppas: y = 0.335x + 1.352; R2 = 0.987
The drug-release kinetic model with the highest regression coefficient value (R2) was considered to be the drug-release mechanism. R2 was highest (0.987) for the Korsmeyer–Peppas model, which describes the diffusion of the drug from homogenous and granular matrix systems.
In Vitro Dissolution Rate of Products Containing Ibuprofen
Dissolution Medium
Solubility of ibuprofen in the following dissolution media was evaluated: buffer pH 7.2, 6.8, 4.5, and 0.1 N HCl. Solubility was highest (5.85 ± 0.59 with standard deviation [n = 3]) in buffer pH 7.2. Solubility was lowest (2.18 ± 0.50 [with standard deviation n = 3]) in pH 1.2 media.
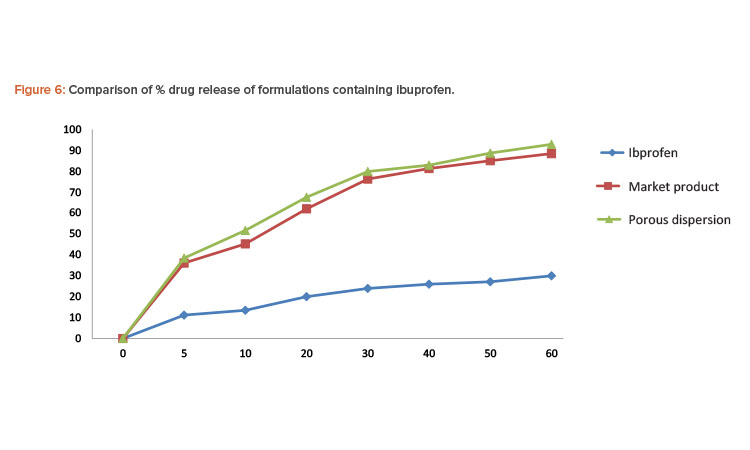
Porous solid dispersion prepared by flash evaporation had a better dissolution profi le than the commercial tablet, and the pure ibuprofen sample had the slowest dissolution rate.
Dissolution
The dissolution medium consisting of 900 mL of phosphate buffer pH 7.2 was placed in the cylindrical vessel of USP dissolution apparatus 2. The apparatus was assembled, and the dissolution medium was heated to 37°C ± 0.5°C before a drug sample was added to the vessel. The sample of solid dispersion granules prepared by the flash evaporation method contained 100 mg of ibuprofen. Additionally, pure drug ibuprofen and a commercially available ibuprofen tablet manufactured using the wet granulation method were tested.
In each test, the paddle was rotated at a speed of 50 rpm and 5-mL aliquots were withdrawn at appropriate time intervals and replaced with 5 mL of fresh dissolution medium. The sample was then passed through Whatman filter paper. The absorbance of the sample was evaluated by UV spectrophotometer at 222 nm. The concentration of ibuprofen in each sample was determined from the standard curve of ibuprofen in phosphate buffer pH 7.2. Percentages of the drug dissolved at various time intervals were calculated (Table 5). Porous solid dispersion prepared by flash evaporation had a better dissolution profile than the commercial tablet, and the pure ibuprofen sample had the slowest dissolution rate (Figure 6).
| % Release of Ibuprofen | |||
|---|---|---|---|
| Time (min.) | Pure Ibuprofen | Commercial Product | Porous Solid Dispersion |
| 0 | 0 | 0 | 0 |
| 5 | 11.19 | 36.12 | 38.46 |
| 10 | 13.52 | 45.26 | 51.68 |
| 20 | 20.01 | 62.05 | 67.58 |
| 30 | 23.96 | 76.25 | 79.86 |
| 40 | 26.01 | 81.29 | 82.91 |
| 50 | 27.12 | 85.06 | 88.68 |
| 60 | 29.98 | 89.46 | 92.89 |
Conclusion
Flash evaporation techniques can improve the dissolution and bioavailability of low-solubility drugs such as ibuprofen by altering their physical and chemical properties. Solid dispersions provide the means to reduce the drug particle size to a molecular level and homogeneously distribute a small amount of drug in a solid form. This enhances a solid drug product’s dissolution rate and content uniformity.
We used various spectrophotometric analyses to evaluate solid dispersions of ibuprofen. The DSC thermogram peak at 67.77°C indicated the presence of ibuprofen in the porous solid dispersion at the molecular level. The XRD study of the porous solid dispersion showed peaks for pure ibuprofen and PVP K-30, indicating that there was no chemical interaction between the drug and the carrier.
In the in vitro dissolution studies of formulations containing ibuprofen, pure ibuprofen had the slowest dissolution rate. The release of the drug from the porous solid dispersion formulation prepared by flash evaporation was rapid compared to the commercial formulation manufactured using the wet granulation method.
A porous solid dispersion prepared by the flash evaporation technique is easier to grind into granules. Therefore, this method facilitates encapsulation, which decreases overall product cost and increases product efficacy.
Our investigation suggests that the flash evaporation technique can improve the efficacy of the solid dispersion by converting it into porous form. The resulting two-in-one product can greatly enhance the dissolution rate by simultaneously exploiting two techniques: solid dispersion and capillarity. This technique has vast commercial potential for a wide range of drug candidates.
About the Authors


