Challenges for Net Zero Carbon Pharmaceutical Manufacturing

The scientific community accepts that greenhouse gas (GHG) emissions cause global warming and climate change.
A recent study published by My Green Lab2 presented data from 74 biotechnology and pharmaceutical companies tracking the change in scope 1, 2, and 3 carbon intensity (measured in tons of CO2 emitted vs. the company’s revenue in USD) since 2015. This study showed that only 9% of the companies currently have targets aligned with a 1.5°C global warming scenario by 2030, which is widely acknowledged to be necessary to avoid the worst impacts of climate change. However, the target dashboard on the Science Based Targets website3 shows a more encouraging status: 42 of 79 companies in the pharmaceutical, biotechnology, and life science sector have approved near-term targets aligned with a 1.5°C global warming scenario. Thirty-seven companies have committed to net zero, yet only four companies have long-term targets.
While commitment to carbon emissions reductions have been evolving over the last decade or more, what really counts is the progress being made on delivering tangible results. The My Green Lab study2 found that the top 15 best-performing companies have reduced scope 1 and 2 carbon intensity by an average of 9.02% year-over-year. Yet if we consider these 74 companies to be representative of the entire biotechnology and pharmaceutical industry, the carbon intensity has increased by over 40% since 2015, with a marked increase over the last 2 years (2020 and 2021). As a whole, the industry is far from performing well in delivering carbon emissions reductions. The global healthcare industry is responsible for 4–5% of global emissions; in industrial nations, this rises to 10% of national emissions, with the pharmaceutical industry making up around 20% of healthcare industry emissions.4
It is becoming clear that there is a large gap between the stated emissions reduction targets and the measurable results being achieved. A handful of companies have a clear vision and long-term strategies for delivering their stated commitments. But most companies do not. If they did, we would see much more progress on embedding fundamental prerequisites, such as energy efficiency, and deploying these at pace within the industry. There is a risk that ambitious and achievable industry targets will regress into “greenwashing” and not solve the problems at hand.
This article aims to provide some insights to help with building organization strategies and action plans for decarbonization and to provide confidence that no-regrets actions can be taken now. The science of climate change is clear, and the sense of urgency is building. Much of what the industry needs to do is very well-understood, very affordable, supports or improves GMP compliance, and relies on proven technologies. It is time to move from target setting to taking meaningful action, at a pace and scale that the industry has not seen previously.
To better understand what decarbonization strategies can be applied in the pharmaceutical industry, one needs to differentiate the emissions by source of origin.
Greenhouse Gas Emissions
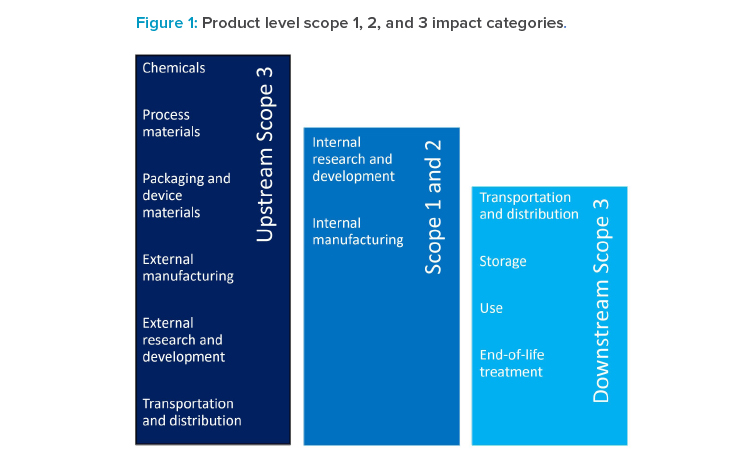
The scopes of GHG emissions are differentiated by what stage in the value chain the GHG are emitted (see Figure 1).
Scope 1 or direct GHG emissions are emitted on premises of a particular company, or by company vehicles and mobile equipment. These could be process-related (e.g., using CO2 as inerting gas) or not (e.g., providing building heating). Emissions are not limited to CO2 as the best-known emitter, but also other gases that have a global warming potential (GWP), often significantly larger than CO2. These include, for example, refrigerant gases like hydro-fluorinated carbons. Typically, emissions of all GHG are converted and expressed as tons, kilotons, or even megatons of CO2 equivalents (CO2eq) based on their GWP.5
Scope 2 or indirect (owned) GHG emissions are emissions related to energy (most typically electricity, but also heat, steam, or cooling) consumed on company premises but generated externally.
Scope 3 or indirect (not owned) GHG emissions are emissions generated by the upstream and downstream value chain needed to ensure proper operations. In other words, scope 3 emissions are scope 1 and 2 emissions of that company’s partners in the value chain. These are a heterogenous class of GHG emissions associated with purchased goods and services to manufacture and distribute a given product. For pharmaceutical companies, purchased goods (e.g., raw materials), use of sold products, and distribution typically compose a significant share of scope 3 GHG emissions; however, depending on the circumstances and products, other categories can also make a sizeable contribution. In the pharmaceutical industry, scope 1 and 2 GHG emissions are usually significantly smaller in proportion to scope 3 emissions. While scope 1 and 2 emissions are typically captured well and under the full control of a given company, scope 3 emissions are significantly less well-understood and not under full control of a company.
GHG emissions associated with a given reporting company are differentiated by scope 1 (by company-owned facilities and equipment), scope 2 (from purchased electricity, steam, heating, or cooling), and scope 3 (emissions in the upstream and downstream value chain).5
Net Zero Ambition in Biopharmaceutical Industry
Scope 1
Carbon emissions classed as scope 1 are firmly within the organization’s control to mitigate but are often the most challenging to decarbonize. The most significant source of scope 1 emissions is associated with on-site combustion to generate heat and power using fossil fuels such as natural gas and diesel/fuel oil. There are other scope 1 emissions to be considered, including volatile organic compounds (solvents) and high-GWP refrigerant gas leakage, which can be very difficult to abate in a practical and economic way in the short term and will most likely be addressed in the longer term through process and technology advancements and sustainability by design principles.
As most manufacturing sites currently require high temperature heat for process, sterilization, and/or quality water generation, the provision of heat can be a major emissions source. Historically, many manufacturing organizations have invested in cogeneration (combined heat and power) to generate electricity as a byproduct of heat generation.
Cogeneration was originally seen as an economic way to provide energy, as it created a level of energy security and provided a carbon reduction benefit. This is no longer the case in most instances. The carbon reduction benefit has been negated by national electricity grid decarbonization, and fossil fuel energy security cannot be guaranteed as seen with the current global energy crisis. While there may be economic benefits, these are rapidly being eroded with fossil fuel price increases and ratcheting local and national government policy leading to increased carbon taxation.
Fortunately, there are alternative, more sustainable solutions for heat provision, although not all of these are low- or zero-carbon solutions. Some of these technologies are mature; others are evolving and developing. Table 1 summarizes the main technologies that are currently being evaluated for application in the pharmaceutical industry.
| Heat Source |
Zero GHG Emissions? |
Description | Upsides | Downsides |
|---|---|---|---|---|
| Electric Boiler | Yes, if power is generated from renewable sources | Steam/hot water boiler produced by electric boiler | More efficient (close to 100%) than fossil fuel boilers (no combustion losses) |
Electricity is often more expensive than fossil fuel> (per unit) Requires additional electricity to be available, which requires suitable infrastructure |
| Electric Heat Pump | Yes, if power is generated from renewable sources and low-GWP refrigerant | Hot water generated by heat pump from a consistent low-grade heat source, normally air or water | Generally, 3–6 times heat output per unit of input energy Can use waste low-grade heat to boost efficiency and deliver more useful temperatures |
High temperature is limited by technology and effciency
|
| Geothermal | Yes |
Water pumped deep underground is heated by the earth through seismic and other geological phenomena
|
Almost completely emissions-free and renewable heat source Low operational cost |
The temperature accessible depends on local geological conditions: >150ºC/300ºF required for electricity generation and only economically viable in regions which are geologically active near the earth’s surface (e.g., Iceland, Hawaii, New Zealand), but lower temperatures can be attained more widely at varying depths and can be used directly or boosted by heat pumps for space heating Deep geothermal yields higher temperatures but is more costly to install
|
| Biomass | No, it is a combustion process | Pelletized plant material (woodchip or rice husk is common) that can be burnt in a boiler to generate heat |
Biomass material from a renewable source Avoids use of fossil fuel Can use material that would otherwise be wasted |
Biomass source availability can be a major Remains a combustion process, so does emit CO2 and other GHGs to environment Can increase scope 3 emissions because it requires delivery to site Concern over land use for biomass vs. food production and subsequent deforestation |
| Biogas (methane) | No, it is a combustion process | Methane is created and captured when anaerobic digestion (AD) breaks down organic matter |
Existing gas boilers can use AD-generated methane with little impact
Power purchase agreements can fund generation capacity increase |
Availability of feedstock for AD plant Remains a combustion process, so does emit CO2 and other GHGs to environment
|
| Green Hydrogen | Yes, if hydrogen is generated from renewable sources |
Electrolysis of water to generate H2 Evolving technology (immature) not currently widely deployed |
Completely clean and high-temperature combustion process |
Small gas molecule prone to leakage: safety considerations are a major factor Requires existing boilers to be converted Supply and cryogenic storage is expensive and complex |
Energy Efficiency
Before considering fuel switching to a renewable/more sustainable source, energy efficiency must be improved. Energy efficiency is often cited as the first renewable fuel and is widely under-exploited. Using fewer resources to deliver the same or more output is inherent in pharmaceutical business practices. The International Energy Agency (IEA) net zero by 2050 roadmap6 recognizes energy efficiency as a key enabler to deliver net zero targets. With rising global demand for energy, doing more with fewer resources is good for the planet, business, and consumers. While fuel switching is a cost to be borne over the long term, energy efficiency delivers immediate benefits with existing, well-proven technologies and will provide lower utility costs.
Detailed studies conducted by Energy Efficiency Consultancy (EECO2) over recent years have shown that almost all biotechnology and pharmaceutical plants can reduce energy use by 20%–50% by applying well-proven existing technologies.7 Energy efficiency can affect both scope 1 and 2 emissions, often concurrently. The general philosophy for scope 1 reduction is to minimize the high-grade (high-temperature) heat demand as much as possible. This involves removing steam use and replacing it with low-temperature hot water.
Major areas for opportunities in existing facilities are discussed in the following sections. This is not a comprehensive list, but gives some examples for consideration that will be important for the low-carbon future. Non-technical measures of energy efficiency can also be considered, e.g., producing batches that require a lot of cooling during cooler periods of the year.
Heating, Ventilation, and Air Conditioning
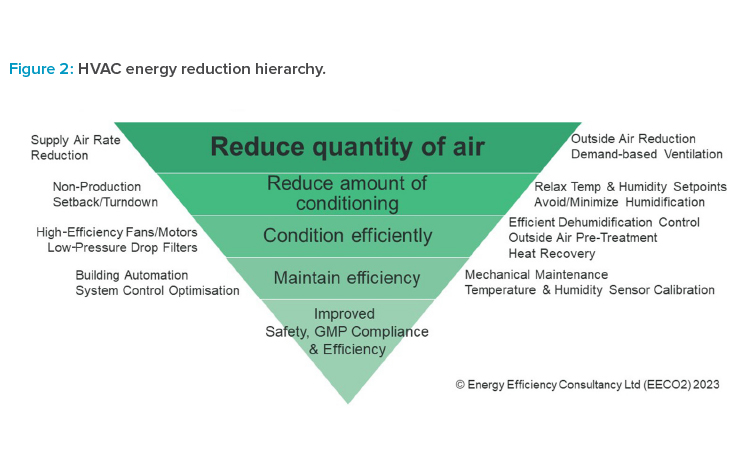
Heating, ventilation, and air conditioning (HVAC) is often the single largest user of energy, so it deserves careful attention. When considering new systems, designers need to account for the impact of climate change on design conditions. More extreme ambient conditions will be more likely in the future. Indeed, many existing systems may struggle to meet internal room requirements due to ambient conditions exceeding the design limits.
There are many well-proven energy reduction actions that can be applied to existing systems and incorporated in the design of new systems (see Figure 2). HVAC used in cleanrooms is particularly demanding and ISO 14644-168 contains useful guidance on actions that can be taken. Avoiding over-conditioning of spaces leads directly to scope 1 reductions. Controlling very precise temperature and humidity setpoints is hugely energy intensive and rarely necessary for product quality. Minimizing outside (fresh) air to the lowest level necessary for pressurization can also limit heating (and cooling) demands. Where dehumidification is a major factor, pre-conditioning the outside air to remove moisture prior to mixing can lead to huge reductions in both cooling and reheat demands. Maximizing recirculation of air and avoiding 100% outside air systems where possible should be a goal. Where recirculation is not possible, for example, where safety or cross-contamination concerns exist, then heat recovery solutions can be fitted as a last-resort, mitigating solution.
When HVAC demand has been fully optimized, there is then the possibility to use low-grade heat for conditioning. Progressive and forward-thinking design teams are routinely designing new HVAC systems to use 40°C–55°C/100°C–130°F or lower water temperature for heating needs. This is by no means the predominant design practice—but why not? HVAC is an ideal sink for low-grade heat recovery, and heat pump efficiency is particularly good within this temperature range. Retrofitting low-temperature heating is not easy but is possible with creative design and engineering.
Water for Injection
All national pharmacopoeia, with the exception of China, allow the generation of water for injection (WFI) compendial water using distillation or any other purification process that is equivalent to distillation methods.9 In November 2022, the Chinese Pharmacopoeia announced the intention to include a chapter on ambient WFI in the 2025 edition. This opens the possibility for high-quality water generation by ambient processes that avoid the need for high-temperature steam. Historically, ambient WFI generation has not been favored by the industry, preferring to stick with the tried and tested methods of multi-effect stills and vapor compression.10 There is some logic in this, but even these trusted methods can experience problems when not designed, managed, or maintained with sufficient care and expertise.
Facilities of the future should consider adopting ambient WFI generation in their designs.10 There is no mandated temperature requirement in any pharmacopoeia 9 and therefore no requirement for maintaining compendial water at elevated temperatures. Regular sanitization with dissolved ozone is highly effective at bioburden control and can provide superior results when compared with heat sanitization. The technology is proven to deliver the required quality and reliability at a lower environmental and cost impact.
Process Heating (Steam)
Where there is a process demand for steam, this will be the most difficult area to mitigate, due to the capital investment already made in vessels and equipment and the burden of revalidating production processes when a change is made, for example, to process at lower temperatures. Sustainable product/production process design will make an impact in the future, but for the immediate challenge the options are limited to:
- Maximize the efficiency of steam generation, avoid waste, and maximize heat recovery.
- Insulate pipework, valves, and steam trap sets to reduce losses. This obvious action remains an area for continuous improvement and easy wins.
- Maintain steam traps/improve recovery of steam condensate.
- Retrofit condensing heat recovery systems to combustion/high-temperature exhausts.
- Preheat boiler feed water with recovered heat.
- Replace process heating loads with electric steam boiler. Having first reduced waste/improved efficiency and removed steam demand from unnecessary HVAC users, then the remaining steam load could be 50% smaller, which makes the transition to electrified steam generation much easier.
With creative and considered design, many of the solutions provided can be retrofitted successfully to existing facilities. Many already have been implemented successfully, and there are plenty of examples in the industry to support this fact. Nevertheless, it remains that transition to a net zero future requires much greater deployment at scale of energy efficiency improvements. Some organizations already know they have 20%–50% or more energy waste in their systems; many others are completely unaware of the opportunity for savings that exists. If your organization does not have an effective energy efficiency program that is delivering 5%–10% of efficiency gains year-over-year, then you are missing out on the easiest and most effective actions you can take to add to bottom-line profit and make a positive impact towards reaching your net zero carbon goals.
Fugitive Refrigerant Gas and Solvent Vapor Emissions
At most pharmaceutical facilities, the emissions related to the leakage of fluorinated gases (commonly used in refrigeration systems) and fugitive solvent emissions (used in various pharmaceutical processes) is small compared with emissions related to energy generation and use. These substances are also highly regulated and controlled, much more than other emissions sources, with the most GHG impactful substances being phased out over time. Nevertheless, these chemicals can have a very high GWP value, meaning that even a small amount of fugitive emissions can have a large influence on global warming.
![Figure 3: Overview of US greenhouse gas emissions in 2020].](/sites/default/files/2023-03/0323_PE_MA_CoverStory_08.jpg)
Alternative low and close-to-zero GWP refrigerants are now available, with many requiring equipment change-out. This needs to be considered over the mid to long term and may require significant investment. In the short term, a pragmatic approach may be to aggressively reduce leakage rates from equipment, as it is only when gases get into the environment that they have an effect.
For solvents, the possible short-term mitigation actions will depend on the scale and nature of the processes emitting these substances. For the longer term, sustainability by design could help eliminate the need for solvent use entirely.
Scope 2
Scope 2 GHG emissions are related to energy that is purchased externally and consumed on company premises. Besides electricity, emissions associated with heat, steam, or cold purchased externally need to be considered. While the latter are typically the minority of scope 2 emissions and are typically neglected on first-pass decarbonization strategies, non-electricity-associated emissions need to be considered in net-zero approaches.
In public language, “green electricity” is very widely used; however, electrical power sourced from the public grid is neither green nor carbon rich per se, as it is a mix of all sources. Energy mixes and associated CO2 conversion factors are available from either the local provider or from public databases.12 In order to source 100% sustainable electricity, either an on- or near-site renewable electricity source needs to be established or electricity purchased from the market needs to be linked with a renewable electricity/energy certificate (REC). An REC is a tradable, nontangible commodity that represents proof that a defined unit of electricity/energy was generated from an eligible renewable energy resource.
Arguably, sourcing renewable electricity using RECs is considered a low-hanging fruit on the decarbonization journey. This is true for most developed countries, especially where renewable electricity is more available. Care needs to be taken in countries with a less-developed renewable electricity infrastructure, especially where local regulations differ from global carbon accounting standards requirements, (e.g., internationally recognized certificate standards do not apply and no rights due to the certificate are transferred to the electricity consumer).
There are several ways to generate renewable electricity or other forms of energy; some are also eligible to generate on or near company premises. Most common for pharmaceutical facilities, as mid-size consumers, is the installation of photovoltaic panels, but other technologies like photothermic or geothermic can be installed, sometimes in combination with panels. Installing on-site renewable capacity technically transforms a scope 2 into a scope 1 energy source; however, it is a contributor to scope 2 decarbonization as it often replaces a carbon-bearing external electricity mix with a more renewable footprint. On-site or near-site renewables can be “classical” investments, i.e., facilities run and owned by the operations owner, or through leasing from a third party that operates and/or financed it initially. The latter is commonly covered by a power purchase agreement (PPA) between energy generator and its user, but other forms of partnership are possible (e.g., in industrial parks). The choice between a PPA and owner operations depends on several factors, e.g., owner know-how, expected payback timelines, and internal depreciation rules and funding priorities.
As photovoltaics are the most commonly used type of on- or near-site renewables, key considerations for the business case should be discussed. When sizing the appropriate photovoltaic capacity for a given site, a few factors need to be taken into account: peak capacity, energy storage, structural factors, and grid integration. Sunlight and electrical power fluctuate within a day and also within a year. Photovoltaic output is commonly defined in peak capacity (in watts); however, it is not a constant source of electricity, as would be ideal for pharmaceutical operations having a rather stable electricity demand. To compensate, electricity from the grid is typically used.
Second, this question needs to be answered: whether electricity generated should be stored and used at later points in time to flatten out the electricity supply. Batteries or other storage solutions are a nonnegligible cost factor and need to be carefully considered. Especially for installations aimed to cover full demand of operations, storage should be investigated carefully.
Third, structural factors like whether the building can carry the additional load of the panel installation need to be considered, and accessory support structures might be needed. Last, the integration of the photovoltaic system in the overarching energy grid infrastructure on-site (and potentially beyond) needs to be examined. Many examples of photovoltaic installations on or near sites of pharmaceutical sites are evidence of its applicability to the industry.13
Finally, other sources of purchased energy (e.g., steam, heat, cold) should be highlighted. In principle, the preceding considerations apply to principles of energy generation, GHG accounting mechanism through certificates, and use.
In summary, the scope 2 decarbonization strategy for a typical pharmaceutical operations site or network resides on sourcing renewable energy covered by renewable energy certificates, coupled with on- or near-site renewable generation.
Scope 3
Scope 3 emissions are the result of activities from assets not owned or controlled by the reporting organization, but that the organization indirectly impacts in its value chain.14 Scope 3 emissions, also referred to as value chain emissions, can represent the largest source of emissions for companies. In the pharmaceutical industry, the biggest impactors are purchased goods (e.g., materials, chemicals), services (e.g., contract manufacturing organizations [CMOs] and contract development and manufacturing organizations [CDMOs]). These impactors need to be influenced directly to engage their own GHG reduction, as well as internally though product-level decisions.
Strategies for decarbonization of scope 3 GHG emissions are manifold. Typically, the absolute emissions, but also the complexity, are higher compared to scope 1 and 2. Keeping scope 3 reductions “for later,” however, is problematic, as regulations in more and more countries define accountabilities and requirements of the manufacturer/market authorization holder concerning their scope 3 emissions.
There are three relevant scope 3 accounting standards that may be used in pharmaceutical industry:
- Scope 3 standard accounts for value chain emissions at the corporate level
- Product standard accounts for life-cycle emissions at the individual product level
- Corporate standard, a standardized accounting methodology for companies to quantify and report their corporate GHG emissions
These three standards provide a comprehensive approach to value chain GHG measurement and management.5
Levers for reducing scope 3 emissions can be grouped into two categories: (1) external supply chain levers and (2) internal business and design lev-ers. The first category requires engagement with Tier-1 suppliers as well as suppliers deeper in the supply chain (Tier-2, Tier-3... Tier-n) to incentivize and support them in reducing their own scope 1 and 2 emissions. Depending on the material or service provided by the supplier, the actions for GHG reduction can vary greatly. A contract manufacturer would likely have similar GHG sources and scope 1 and 2 solutions as other biotechnology and pharmaceutical manufacturers compared to a transportation provider or supplier of agricultural raw ingredients and therefore require different mitigating actions.
Levers for how to engage this variety of suppliers as a customer can be mapped on two axes: financial versus nonfinancial and reward versus penalty14). For example, a financial reward could be providing beneficial terms while a nonfinancial penalty could be the use of decarbonization criteria in procurement.15 For suppliers to address their own scope 2 emissions, which are part of customers’ scope 3, suppliers can join strategic partnerships for sourcing renewable energy, such as the Energize program via Schneider Electric.16
The second category covers the internal business choices that have an influence on scope 3 emissions. This could range from product and process design decisions (e.g., solvent selection, inhaler propellant replacement, and packaging design) to employee travel and commute policy (e.g., limiting air travel, favoring zero/low-emissions modes of transportation on daily commute), and everything in between. To accelerate decarbonization across the value chain, it is also important to push for additional innovative solutions, by funding and piloting new green technology.17
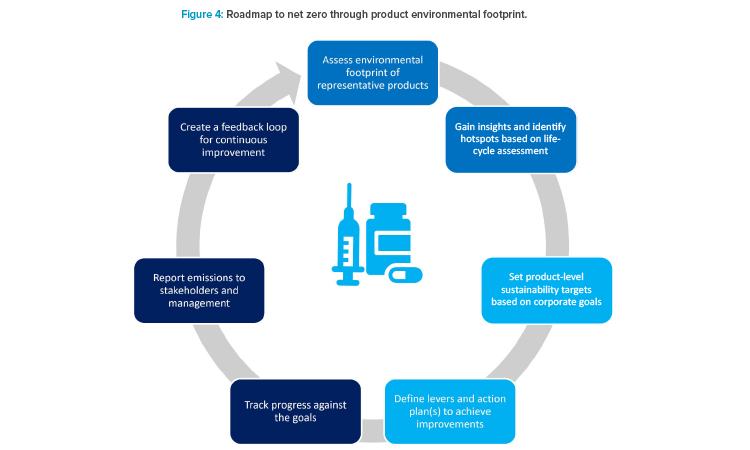
A product-driven scope 3 perspective aims at making informed choices to reduce GHG emissions from pharmaceutical products. The first step is to understand the carbon footprint of the full life cycle of the product. This assessment helps identify “hot spots” or key drivers of carbon footprint, which in turn helps indicate activities that could have the most impact on scope 3 emissions. Based on the calculations used for product declarations, the emissions baseline can be assessed, and scope 3 reduction planning can be done. In general, these will be done via prioritizing, identifying, and implementing design levers in research and development. In addition, depending on the company climate goal ambitions, additional investigation into design lever opportunities for the commercial portfolio is needed. Decarbonizing commercial products is challenging due to the highly regulated nature of the industry. However, depending on a product’s refiling schedule, opportunities will arise to integrate scope 3 reduction opportunities.
When combined with an action plan and performance measurement, product-level sustainability standards form the basis of an effective scope 3 re-duction strategy, helping businesses meet evolving net zero requirements and respond to pressures from customers, value chain, and regulators (Figure 4). It is important to note that external manufacturing in CMOs contributes to scope 3 emissions. Outsourcing to CMOs does not eliminate GHG emissions; it just shifts the scope 1 and 2 emissions to the CMO and scope 3, which may have a worse emissions profile than a company-owned manufacturing sites. Therefore, it is important to carefully select CMOs (as well as other suppliers of goods and services), to ensure they have acceptable environmental sustainability credentials, and to verify they apply rigorous GHG emission reduction protocols.
Conclusion
Given the urge to address climate action, the pharmaceutical industry must contribute to a global solution of this crisis. Strategies are based on a mix of generic, industry-wide, sector-specific, and company-specific approaches, which need to be embedded in the framework of international guidelines and declaration and control mechanisms. Some elements of the decarbonization journey can be considered quick wins: others require significantly more time, financial resources, and efforts.
Top management needs to be—and remain—engaged in this journey, which will be a task for decades to come. While the pharmaceutical industry has not yet experienced very strong regulatory, public, and customer/patient headwinds when it comes to sustainability, expectations and pressure will rise. For example, environmental, social, and governance (ESG) ratings and sustainability reports have gained enormous importance to financial analysts and investors and will be increasingly scrutinized. Investing in sustainability is no longer seen as nice to have, but as an essential investment in fu-ture-proofing any company’s foundation. Moreover, being focused and delivering on sustainability is a crucial factor in attracting and retaining the right talent,18, 19 especially among the younger generation.
Last, efforts to achieve decarbonization may also have other benefits, such as reduced resource footprint (e.g., reduction of water and waste), including circularity principles into the operations (e.g., solvent, water recycling) and products (e.g., recycled content in packaging, reduction of packaging weights).
About the Authors