Process Validation Lifecycle for Packaging Oral Solid Dosage Forms

The ISPE Discussion Paper “Overview of Packaging Validation for Drug Products” explores the different ways to implement packaging validation; however, it does not provide specific guidance on OSD forms packaging. This paper aims to address this gap using concepts based on the 2011 FDA Guidance, Process Validation: General Principles and Practices. Covering Stages 2.2 and 3, this paper discusses risk assessments, developing sampling plans using Acceptance Quality Limit/Rejectable Quality Limit (AQL/RQL), and statistically determining an intra-batch sampling plan.
In August 2017, ISPE published the Discussion Paper “Overview of Packaging Validation for Drug Products,” which explores the different ways to implement packaging validation; however, it does not provide specific guidance on oral solid dosage forms packaging. This paper aims to address this gap using concepts based on the 2011 FDA Guidance, Process Validation: General Principles and Practices. Topics discussed in this Discussion Paper include managing risks in Stages 2 and 3 and using the statistical analysis of Stage 2.2 results as part of a comprehensive PPQ evaluation. Additionally, developing and implementing a Continued Process Verification plan is reviewed. The author team is interested in receiving feedback on the topics presented for applying the process validation lifecycle to oral solid dosage forms packaging, including lessons learned through regulatory agency feedback during review and inspection.
The paper may be modified or expanded sometime in the future to reflect additional input.
Please direct all feedback to pvpapers@ispe.org.
1 Introduction
Packaging validation is the collection and evaluation of data to establish evidence that the packaging process is capable of consistently delivering packaged product that retains its suitability for its intended use. This paper presents concepts for implementing the process validation lifecycle approach to Oral Solid Dosage (OSD) forms packaging processes.
The ISPE Discussion Paper “Overview of Packaging Validation for Drug Products” 1 explores the different ways to implement packaging validation; however, it does not provide specific guidance on OSD forms packaging. This paper aims to address this gap using concepts based on the 2011 FDA Guidance, Process Validation: General Principles and Practices 2. Covering Stages 2.2 and 3, this paper discusses risk assessments, developing sampling plans using Acceptance Quality Limit/Rejectable Quality Limit (AQL/RQL), and statistically determining an intra-batch sampling plan. Additionally, a review is provided of the Process Performance Qualification (PPQ) statistical analysis with suggestions for risk-based assessments to address results beyond specifications as part of a comprehensive evaluation. Developing and implementing a Continued Process Verification (CPV) plan is also presented.
2 Background and Scope
A packaging system is “the sum of packaging components that together contain and protect the dosage form. This includes primary packaging components and secondary packaging components, if the latter are intended to provide additional protection to the drug product. A packaging system is equivalent to a container closure system.” 3, 4
The packaging system for OSD forms includes:
- Immediate container and closure (primary packaging components), typically either:
- Plastic (usually High-Density Polyethylene (HDPE)) bottle with a screw-on or snap-off closure
- Flexible packaging system such as a blister package
- Labeling
- External packaging (secondary packaging components, e.g., cartons, shrink wrap)
While discussion in this paper is limited to tablets, capsules, and caplets, the concepts can be applied to other OSD forms such as granules, beads, etc.
OSD forms need to be protected from water vapor, light, and/or reactive gases. For example, the presence of moisture may affect the degradation rate of the active drug substance in the drug product. Therefore, before packaging validation can begin, the packaging system must be: 3
- Shown to adequately protect the dosage form
- Compatible with the dosage form
- Composed of materials that are considered safe for use with the dosage form and the route of administration
The need to perform packaging validation is commonly evaluated in the following situations:
- New packaging presentation
- Initial or revalidation of legacy packaging processes*
- Changes to packaging components
- Changes to the:
- Packaging facility, for example, relocation, environmental
- Packaging equipment, including transfer to a different packaging line
- Tooling and/or processes
*Note: The intent of the 2011 FDA Guidance for Industry: Process Validation: General Principles and Practices 2 is not to require revalidation of all existing processes using the more rigorous approach described in the guidance. It is up to the manufacturer to perform the necessary risk assessment to determine whether revalidation is warranted or if Continued Process Verification (CPV)/Ongoing Process Verification (OPV) is sufficient. This risk assessment is addressed in the ISPE Discussion Paper “Overview of Packaging Validation for Drug Products” 1, and in Section 3 of this packaging OSD forms paper. Additionally, while the FDA guidance was not written to cover packaging specifically, principles in the guidance can be applied to the packaging process.
In addition to protecting the product, the assembled packaging system should be shown to contain the correct product and safety information.
Evidence of a consistent and reliable packaging process is obtained through the collection and evaluation of data via a three-stage process similar to the lifecycle process validation stages:
- Stage 1: Packaging Process Design
- Stage 2: Packaging Process Qualification
- Stage 3: Packaging Continued Process Verification (CPV) (also known as Ongoing Process Verification (OPV))
Identification, assessment, and control of variability occur throughout the packaging validation lifecycle, just as in drug manufacture. As with the manufacturing process, the complexity of the packaging process and variability of the input materials should be considered.
Unlike other pharmaceutical processes, in the packaging process for OSD forms the manufactured dosage form is used and the process validated is filling the container closure/packaging system with tablets/capsules. Another difference is that much of the data available from the packaging process is attribute data, that is, not numeric or continuous (e.g., number of defects, pass/fail).
In Stage 1, the packaging process is defined based on knowledge gained through development, equipment qualification, and platform experience. For OSD forms, packaging requirements generally relate to the design characteristics of the container (e.g., tight, well closed, or light resistant). A packaging system should provide the dosage form with adequate protection from factors that can cause degradation in the quality of that dosage form over its shelf life (e.g., temperature, light, reactive gases, absorption of water vapor, microbial contamination). Laboratory studies conducted during development (Stage 1) can be used to determine the factors that affect the drug product. Some interactions between a packaging component and dosage form will be detected during qualification studies on the packaging system and its components. Others may be found only during the package-specific stability studies.
In Stage 2, Process Qualification, the packaging process defined in Stage 1 is evaluated to verify if the process is capable of reproducible commercial packaging. Stage 2 is comprised of:
- Stage 2.1 – Design of Packaging Facility and Qualification of Equipment and Utilities
- Stage 2.2 – Packaging Process Performance Qualification (PPQ).
As a prerequisite to the packaging PPQ, the qualification of equipment is performed, including verification that the equipment is installed correctly and operates as expected under anticipated conditions and over the full operating ranges. Performance qualification verifies the ability of the process to meet user required specifications under planned manufacturing conditions. Qualification of performance integrates procedure, personnel, systems, and materials in producing the required output. Speed challenges to demonstrate that the integrated packaging line works as intended are also included. Confirmation that the packaging process can produce repeatable results when run at normal operating conditions (using the recommended parameter settings) is done during PPQ. Confirmation is performed over a longer time period and under greater operational variability.
Packaging CPV (Stage 3) is monitoring during routine packaging operations to provide ongoing assurance that the packaging process remains in a state of control. Also referred to as OPV, it includes:
- Heightened testing and monitoring (also referred to as enhanced monitoring or Stage 3.1)
- Periodic between-batch data analysis to evaluate process capability and variability (e.g., due to equipment, components, environment)
Moreover, CPV may identify opportunities for process improvements and/or changes to the control strategy (may include reject stations, vision system, weight checks, code readers, etc.).
This paper limits its discussion to Stages 2.2 and 3 of packaging validation. It is assumed that all prerequisites for performing PPQ (trained personnel, qualified facilities and equipment, etc.) and GMP requirements during PPQ (such as documenting deviations) are met. This paper discusses risk assessment, sample size considerations (e.g., number of batches, number of samples within a batch), and acceptance criteria for validation, statistical analysis, and CPV.
3 Risk Assessment
Risk assessments are used for decision-making throughout the packaging process lifecycle, just as for a drug manufacturing process. Specifically, a risk assessment should be performed prior to the packaging PPQ to justify the approach (detailed in Sections 4, 5, and 6: number of runs, representative presentations used, materials, sampling schemes, etc.). The risk assessment is based on packaging process knowledge from similar processes and the accumulated knowledge from Stage 1 (development), which itself is based on iterative risk assessments used to define and hone the packaging process design and control strategy as more data is accumulated.
The assessment of risk at the end of Stage 1 should minimally focus on the following:
- Experience with, and understanding of, the packaging process and packaging configurations (including possible interactions with the drug product)
- Control strategy in place to prevent packaging defects (the control strategy will be examined to confirm the adequacy of the process design and to demonstrate that the commercial packaging process performs as expected)
- Complexity of the packaging process
- Product-specific risk due to package defects (for example, moisture sensitivity)
- Impact to patient
A typical packaging operation is composed of:
- Preparation activities (materials check, control and production line set up)
- Production (adjustment of parameters, calibrations check, controls check, in-process controls, shift changes, etc.)
- Shut down activities (batch and packaging materials reconciliation, line clearance)
Start-up and shutdown activities are included during PPQ just as in routine packaging (i.e., the process is run in PPQ as it will be run during routine manufacturing); however, these activities are typically used for making minor adjustments to the process to ensure smooth running, and the samples taken are not considered part of the PPQ samples or included in the statistical analyses. This mimics routine manufacturing where the commercial batch begins only after start-up checks are complete.
The risk assessment should address all operation stages/unit operations within scope of the PPQ, normal production order lifecycle, and the challenges seen during that lifecycle (e.g., different packaging materials lots).
If activities such as de-bottling and de-blistering are used in the packaging process, they should be included in Stage 2. They may not be applicable for all packaging processes, but where they are, the risk assessment should include these activities, focusing on their impact on the physical attributes of the dosage forms as well as other considerations such as:
- How long can the product be stored before re-packaging?
- How many times can a product be de-blistered or de-bottled, etc.?
Data from development (for example friability, hardness, tendency to chip) and knowledge from similar products may also be used for the risk assessment. The proposed PPQ sampling plan should enable the comparison between these batches/fractions and the other Stage 2 batches as an outcome.
Some packaging processes have better reproducibility and capability due to:
- More automated packaging processes, which help to reduce the risk for human errors
- 100% online control of packaging quality attributes and process parameters for many processes (for example, vision systems, induction sealing by thermal systems)
These differences will be reflected in the risk assessment as risk-reducing elements.
In some cases, validation of one packaging process for several dosage strengths, counts, and container closer systems of the same product may be appropriate, and a bracketing approach may be applicable in this situation. Matrixing across different products may also be justified, for example, to evaluate the packaging of different products in a common packaging presentation. Both matrixing and bracketing approaches should be justified and documented through a formal risk assessment process. A robust and thorough quality program is foundational to bracketing and matrixing during PPQ. This is discussed in more detail with examples in the ISPE Discussion Paper “Overview of Packaging Validation for Drug Products” 1.
4 Number of Batches
The risk assessment described in Section 3 may be used to guide the selection of the number of batches for packaging PPQ, for example using an approach such as the first one described in the 2014 ISPE Discussion Paper “Stage 2 Process Validation: Determining and Justifying the Number of Process Performance Qualification Batches.” 5 The number of batches (or packaging runs) to include during packaging PPQ is also often based on logistical and practical considerations, such as matrixing and bracketing, as noted in Section 3. Examples of matrixing are provided in Section 11.
A risk-based approach to determining the number of batches is appropriate since:
- Important sources of variability (e.g., raw material lots, drifts in environmental controls) impacting the process do so over a longer period of time than is reasonable for PPQ
- PPQ in the lifecycle approach is just the first step of ongoing process monitoring during which the long-term process variability will be understood
- The types of data prevalent in the packaging process (counts and proportions) make it particularly challenging to meet statistical acceptance criteria with a limited number of batches, such as would be reasonable for PPQ
While a statistically based approach is possible, this will likely result in an unreasonably large number of batches and may deter companies from applying the lifecycle approach and statistics to packaging processes. Further, a risk-based approach is generally widely accepted in industry. The formal statistical analyses in PPQ are thus primarily focused on demonstrating intra-batch (packaging run) capability. While inter-batch variability should always be examined during PPQ, it is best understood during Stage 3 (CPV) when data from a sufficient number of batches, and over a long enough period to incorporate long-term sources of variability, are available for robust analysis. During PPQ, a high level of sampling can be performed within-batch to assess defect rates with high confidence, as discussed in Section 6. Nevertheless, available process knowledge and risk assessment of the different steps in the packaging process, as well as material variability included during equipment qualification, can be helpful in ensuring that the number of PPQ batches selected provides confidence that the packaging process consistently produces packaged units as intended.
Many facilities have multiple packaging lines for packaging tablets and capsules, for example, multiple bottle or blister lines. While individual pieces of equipment may vary from one line to another, the overall process and related risks for (for example) a bottle line, will be similar. Thus, knowledge of, and experience with, one bottle line could help mitigate risks associated with a new bottle line and reduce the number of batches needed for PPQ, while ensuring that unique product-specific characteristics are not overlooked. Further, well understood packaging process/packaging configurations may need very few batches for PPQ due to the low residual risk following development activities. A less well understood packaging process may need several batches based on the increased risk to patients or to GMP compliance. Ultimately, the goal of PPQ is to demonstrate that the packaging process is well-controlled and can consistently perform as intended, and the number of batches should be selected based on the residual uncertainty regarding performance following Stage 1.
The size of the batch is also an important consideration in determining the number of batches, as it will impact whether a sufficient number of representative samples can be obtained for providing assurance on the process capability. If the batch size is small, as dictated by business needs, multiple batches may be necessary to provide the desired level of assurance in the capability of the packaging process. Alternately, if fewer batches are to be used, it is essential that they be run long enough to capture typical process variability.
A packaging line is often used for multiple products, and once the line is set up for a specific product, the focus for packaging PPQ is typically on product-independent characteristics, that is, defects such as damaged blisters or low fill bottles. As such, the number of batches needed for PPQ could be made up of multiple products. They could also consist of different formats or configurations for primary and secondary packaging, different security features and other packaging requirements, and use different raw material batches.
In addition, as with any process validation, representative development (Stage 1) or Performance Qualification (PQ) batches/runs may be included in the Stage 2 PPQ analysis, with appropriate justification. Thus, the number of Stage 2 batches required will be the total number determined based on the residual risk assessment minus any such Stage 1 batches that may be included. The PPQ batches may cover the entire packaging line (primary, secondary, and tertiary packaging), or secondary and tertiary packaging may be assessed separately. For primary and secondary packaging, the focus is on labeling and attributes that protect the drug product; while for tertiary packaging, the focus is primarily on correct count of secondary packs and labeling.
5 AQL/RQL to Determine Validation Sampling Plans
As mentioned in Section 4, the focus of statistical analysis during PPQ is on demonstrating intra-batch capability. Many of the quality attributes relevant to packaging processes are qualitative, for example, the presence or absence of a defect. These attributes are often characterized by the number of defects observed among a sample of units inspected. The proportion of defects observed in the sample provide an estimate of the true proportion of defects in a batch. This section provides background information on commonly used terminology in developing the sampling plans for understanding intra-batch capability.
Acceptance sampling plans provide the number of units to be sampled/inspected and the acceptance criteria. Sampling plans are fully characterized by their Operating Characteristic curves (OC curves), and are typically described by two parameters, AQL and RQL. AQL is the minimum level of quality routinely accepted by the sampling plan. A process at or below the AQL will result in accepting lots with high probability, for example 95%. As such, an AQL is associated with producer’s risk, that is, the risk of rejecting a “good” lot. RQL, also known as Limiting Quality (LQ) or Lot Tolerance Percent Defective (LTPD), is the level of quality routinely rejected by the sampling plan. A lot at the RQL quality level will be accepted with low probability, for example 10%. Thus, an RQL is associated with consumer’s risk, that is, the risk of accepting a “bad” lot. The RQL provides a better criterion for driving quality during packaging PPQ by providing a reliable estimate of the true defect rate, namely, high confidence in the estimated defect rate.
How to select an AQL and an RQL
During commercial manufacturing (Stage 3), AQLs are selected for different defect types to reflect the severity or criticality based on the impact of the defect type to patients, to GMP compliance, and/or to the business. Different companies have different ways of characterizing severity but the categories Critical, Major, and Minor are often used to represent varying levels of severity, with associated definitions determined by the company. Note that some may take the view that a critical defect need not necessarily cause harm to the patient but may generate customer quality complaints, which may prompt companies to monitor these defects.
While no single AQL value for a category will adequately characterize these defect types for all organizations, the following levels are commonly used in the industry (e.g., one organization may select 0.01% to apply to its packaging quality attributes while another may select 0.1%):
- Critical: 0.01-0.1%
- Major: 0.1% to 2.5%
- Minor: 2.5% to 6%
For Stage 3 commercial manufacturing, an RQL can be determined from the OC curve for any sampling inspection plan chosen and will vary by defect type. While the RQL for PPQ may be chosen in many ways, the recommended approach is to select an RQL equal to the AQL associated with the defect type during routine packaging. With this approach, the defect rates can be estimated with high confidence, which in turn helps in determining suitable sampling and inspection criteria during routine packaging.
Sampling plans can be derived statistically to meet the requirements of the validation. For example, if an RQL of 0.065% (equal to the AQL) is chosen with an acceptance criterion of 0/1, then using a binomial distribution, 3550 units must be inspected and found to be defect free to provide 90% confidence that the batch contains no more than 0.065% defects. If fewer units are inspected during validation, there is lower confidence associated with the estimates of the defect rates.
With attribute data, it is often acceptable to combine data across multiple batches. This can help reduce the number of samples required in each PPQ batch while still providing high confidence in the process as long as an appropriate number of samples are inspected across all batches. Additionally, if there is justification to include Stage 1 batches in the PPQ analysis, samples from those batches can be used to reduce further the intra-batch sample sizes in the PPQ batches.
Note: In these cases, the quality statement applying to a single batch is not as strong. This must be justified, stated clearly in the PPQ protocol and analysis report, and considered for CPV planning.
If it is not possible to inspect the recommended number of samples during PPQ, then a company may choose to accept a lower confidence level associated with the true defect rate from validation and obtain the additional confidence by implementing enhanced monitoring (Stage 3.1) for the first few commercial packaging batches.
6 Number of Samples Within Each Batch
The intra-batch (or packaging run) sampling plan for PPQ should be chosen so that a thorough statistical analysis of intra-batch variability can be performed, including examination of sources of variability within a batch or homogeneity across a run (from beginning to end), as appropriate for each CQA.
A recommended way to determine the optimal number of intra-batch samples is to target specified statistical criteria, examples of which are presented below. The minimum number of samples required within each batch is determined such that if the statistical criteria are met, there is confidence that a high proportion of all units in the batches – not just the tested samples – is acceptable. This also provides evidence that PPQ batch performance is as expected based on pre-PPQ experience, since differences from the mean and/or variability assumptions based on pre-PPQ data increase the chance that the statistical criteria will not be met.
However, as discussed in more detail in Section 7, using a statistical criterion as the sole reason for passing/failing the PPQ is not recommended. Statistical criteria might best be considered preliminary criteria, to emphasize that meeting them provides evidence of acceptable PPQ performance, but that the statistical analyses are only part of an overall risk assessment of the packaging process conducted at the end of PPQ prior to commercial manufacturing. Some companies may use tiered statistical criteria to guide appropriate actions/monitoring post-PPQ. For example, meeting a statistical criterion with 95% confidence may be considered as “easily met” not requiring further action, while meeting the criterion with 80% confidence may be considered as “marginally met” leading to further action. Such a tiered approach, if used, could be with respect only to confidence, or only to coverage, or both.
In general, regardless of the type of data to be analyzed for a given packaging attribute, the goal of PPQ is to demonstrate that the packaging process is capable of reproducible commercial packaging. Statistical intervals provide a specific confidence (frequentist intervals) or probability (Bayesian intervals) that a certain proportion of all units in a batch will meet specifications or be within a specified range. In other words, statistical intervals provide assurance by making an inference about the quality of the untested units in the packaging run –that is, a quality statement about units beyond those in the sample. Three types of intervals are used most frequently:
- Parametric (Normal) Tolerance intervals (continuous data)
- Confidence intervals for proportion non-conforming (attribute data)
- Bayesian intervals (continuous or attribute data)
Parametric (Normal) Tolerance Intervals (Continuous Data)
A ./ß Tolerance Interval (TI) provides the range within which ß% of results in a population will fall, with .% confidence (ß is referred to as “coverage”). Thus, a TI within specifications provides statistical assurance regarding the proportion of the entire packaging lot meeting requirements. Typical levels of confidence and coverage range from 90% to 95% and 90% to 99%, respectively; specific choices of each should be tied to the severity of the non-conformance to the patient and to process uncertainty. The Normal distribution-based TI is appropriate for continuous data that is at least approximately normally distributed1, and from a process in which no unusual trends are observed.
1 Although the exact limits of a tolerance interval will be affected by small departures from normality, tests for normality are not recommended. For the purposes of comparing the limits to specifications, as long as the distribution of results is unimodal and continuous, the impact on the conclusions from using a normal TI with non-normal data is expected to be small. If the process is performing so close to specifications that small differences in the calculated TI limits would change the conclusion, then further work to understand the reason for that or alternative statistical methodology should be explored. Transformations are not recommended unless justified by a known mechanism explaining a non-normal distribution of the parameter being measured.
Note: Samples from multiple portions of a batch (e.g., stratified, nested, or systematic sampling) or from multiple batches should not be combined to estimate a single TI without the assistance of a statistician.
Example of a statistical criterion based on a 95%/99% TI: “There is 95% confidence that 99% of closure torques will be within specifications.”
Confidence Intervals (specifically, Confidence Upper Bounds) for Proportion Non-Conforming (Attribute Data)
For attribute data, a y% confidence upper bound on the proportion non-conforming estimated from a sample provides statistical assurance that the population proportion non-conforming is no higher than the upper bound of that interval. Typical levels of confidence range from 90% to 95%; specific choices of confidence and proportion non-conforming for which the confidence is required should be tied to the severity of the non-conformance to the patient, and to the residual risk for the process.
A common practice is to use the AQL intended for routine Stage 3 production as the RQL in PPQ; in other words, with this approach the goal of PPQ is to provide statistical confidence that the proportion non-conforming is less than the routine AQL. It may be appropriate in some cases to distribute the required samples across multiple batches, particularly for packaging PPQ, but this requires justification of the assumption that the non-conformance is truly a random event from a single distribution and therefore expected to be similar batch to batch. In this case, the product most sensitive to package defects may require multiple batches, and would also be the basis for determining within-batch sample sizes. Furthermore, if this approach is used, the decisions regarding enhanced sampling in initial CPV should take this into account.
Example of an acceptance criterion based on a Confidence interval (CI): “There is 95% confidence that the proportion of non-conforming units is less than the routine AQL.”
Bayesian Intervals (Continuous or Attribute Data)
Bayesian intervals are another category of statistical intervals that result in statements regarding the range in which a parameter or result will fall, but the computation and interpretation are quite different from the frequentist TI and CI discussed above. A Bayesian interval may be appropriately used for either continuous or attribute data and provides a statistical statement regarding the ability of the packaging process to consistently meet requirements. Bayesian intervals are more computationally complex, but are also more flexible in that they do not require any particular underlying data distribution and can easily accomodate multiple sources of variability and/or unbalanced sampling plans. As with TI and CI on the proportion non-conforming, a logical statistical criterion for PPQ using a Bayesian interval is that the interval should fall within certain limits that are linked to specifications (in fact the limits may be the specifications), with probability tied to patient risk.
Example of an acceptance criterion based on a Bayesian interval: “There is at least 95% probability that at least 95% of results will be within specifications.”
The within-batch sampling plan for PPQ should be determined based on both statistical considerations – that is, minimum intra-batch sample size chosen such that if the process performance is as expected, there is a high probability of meeting the statistical criteria– and other logistical and process considerations. The type of sampling plan (simple random sample, stratified random sample, systematic sampling) must also be chosen considering process knowledge and the statistical analyses to be performed (to calculate statistical intervals such as the ones described above, and also for other statistical evaluations such as variance components analyses, etc.). Examples of logistical and process considerations are:
- Sampling at important process points (start-up/end of run, process change points)
- Stratified sampling to allow estimation of variance components (multiple filler heads, multiple samples at specified sampling locations, following a material batch or roll change)
In most cases, the level of sampling performed in PPQ is higher than in routine packaging; in fact, the demonstration of process performance based on this enhanced sampling in PPQ (and perhaps continuing in Stage 3.1 of CPV) provides strong justification for reduced routine sampling. Exceptions to having higher than routine sampling levels in PPQ are when 100% inspection and/or automated controls using Process Analytical Technology (PAT), for example, are implemented as part of the control strategy. In this case those control strategy elements must be qualified prior to PPQ. The PPQ (and CPV) batch analysis uses the results generated from PAT monitoring as appropriate, but in the case of 100% inspection, alternate performance metrics such as the number of rejected units per batch may be of interest.
If Stage 1 batches and qualification batches are included in the PPQ analysis, then additional samples from those batches may need to be taken and measured to align with the PPQ intra-batch sampling plan, or a plan for including those batches in the analysis with a different number of samples from the PPQ batches should be made and included as part of the PPQ sampling rationale documentation.
Regardless of which sampling plan and statistical criteria are chosen for PPQ, including any tiered criteria, it must be clearly stated in the PPQ protocol.
7 Statistical Analysis for Process Performance Qualification
Prior to initiating Stage 3 of the Packaging Validation lifecycle (CPV), the PPQ batch data is analyzed to determine whether and to what extent the capability of the packaging process to reproducibly manufacture acceptable packaging has been demonstrated. This analysis begins, critically, with a visual examination of the PPQ data, looking for:
- Consistency of within and between-batch means and variability
- Comparability to representative pre-PPQ batches
- Consistency with expected performance based on process and analytical knowledge
This visual examination of the data before any statistical analyses are performed – statistical intervals, variance components analyses, even calculating means and standard deviations – is critical because it may reveal unexpected sources or magnitudes of variability (within or between batches) or non-random patterns in the data that provide key insights into the packaging process.
As described in Section 6, the within-batch sampling plan for PPQ should ideally be designed based on a planned statistical analysis, so that the data analysis will be straightforward:
- Perform visual examination of the data as noted above
- Perform the within-batch statistical analysis as planned (and any supplemental analyses indicated by the visual data examination)
- Assess the comparability of results across batches to provide an initial assessment of between-batch variability (between-batch variability will be more fully assessed during Stage 3.1)
If these statistical evaluations are all acceptable and all other (non-statistical) PPQ criteria are satisfied, then the focus shifts to planning sampling for the initial part of CPV.
As noted, a particular challenge for packaging processes is that most of the data are discrete (count) data, and for many non-conformances, the counts will be very small (in some cases, all zero). For this attribute data, the statistical analysis will generally be to estimate the CI (upper bound) on the probability of non-conformance and compare this to a determined number (often the routine AQL, as discussed).
While for continuous measurements, combining data across batches to estimate statistical intervals must be done using specialized statistical methodology, it is generally acceptable to combine counts across multiple PPQ batches to estimate a CI on the proportion non-conforming. However, if the proportions appear to be quite different among the batches, the reasons for this should be evaluated to determine whether it is appropriate to combine the data. The number of non-conformances (or defects) may also be trended using appropriate graphical methods, for example, control charts, where applicable. More information on this is provided in subsequent sections. In this case, data available from equipment PQ runs should be included where appropriate (i.e., if PQ runs were performed using product).
The evaluation of the PPQ results against the statistical criteria used to design the intra-batch sampling plan for PPQ is only one part – albeit an important part – of the overall PPQ statistical analysis. Graphical evaluations of performance within and between batches, estimation of variance components where relevant, and comparison (graphically and numerically) of PPQ batch results to development batches are at least as important parts of the statistical analyses to be performed as part of PPQ.
This comprehensive statistical analysis is likewise a key part, but not the entirety of, the overall PPQ evaluation. As noted earlier, the authors do not recommend treating statistical criteria in PPQ as strictly pass/fail criteria for PPQ; rather they may be used to identify potential uncertainty about confidence and/or capability to drive the post-PPQ sampling and monitoring. The statistical criteria represent the desired statistical statement of capability to be made at the end of PPQ, but if the PPQ batch results do not meet the statistical criteria used for intra-batch sample size selection, this need not mean that the batch, or the entire packaging process, fails PPQ. This approach recognizes that the cause of any statistical interval extending beyond specification may be statistical in nature, such as inadequate sample size, an outlier, etc.
Thus, this situation should not necessarily trigger PPQ failure, as the process may in fact be quite capable. The PPQ protocol should allow a risk-based assessment of results for intervals beyond specification to determine the path forward, with guidance from a process Subject Matter Expert (SME) and a statistician when possible. This could include evaluating lower confidence and/or coverage levels, for example, but should always include a comprehensive (statistical and non-statistical) evaluation of PPQ performance. In fact, a truly risk-based approach should include the possibility that PPQ could fail or (more likely) lead to continued enhanced sampling in CPV even if statistical intervals are within the limits used for planning, if other evaluations (graphical, etc.) reveal unexpected variability or performance different from expectations based on development.
PPQ of a packaging process is just the beginning of ongoing process monitoring that will continue throughout the life of the packaging process. Thus, rather than making the very costly decision (to the manufacturer, but also to patients from higher development costs and/or lost or delayed access to the product) that PPQ fails based solely on statistical criteria, further process evaluation by SMEs (running at different settings, etc.) and/or additional statistical analyses can be undertaken as part of a risk-based assessment of the totality of results from PPQ.
While generally it is not feasible to specify criteria for this risk-based evaluation, the questions to address during this assessment typically include:
- Why was the statistical interval not within expected limits: was the within-batch variability higher than expected, or was the batch or process mean different from expected?
- Can any root cause can be determined for results different from expected or variability beyond what was observed in Stage 1?
- Most importantly, are the within-batch variability and capability acceptable, despite the statistical interval not being within limits used for designing the intra-batch sampling plan?
The last item above warrants some additional clarification. Statistical intervals – particularly Normal tolerance intervals – are quite conservative (wide) when estimated from small sample sizes. It is important also to recognize that in some cases the sample size chosen for PPQ may simply have been too small, while performance is still acceptable. If the first two questions and related evaluations do not reveal any unexpected or special cause variability and capability appears acceptable, the possibility that too small a sample size is the cause of failing to meet statistical criteria should be carefully considered (ideally in consultation with a statistician).
This risk assessment should be made based on process and packaging understanding, risk of non-conformances to the patient and process, and in the context of understanding the impact of sample size and variability on statistical intervals. And, importantly, while numerical criteria for completing this risk-based evaluation are generally not relevant, the protocol should include the steps to be taken as part of the evaluation.
As noted in Section 4, while the number of PPQ batches is likely be too few to support a formal statistical analysis of between-batch variability or capability, it is still important to assess between-batch variability at the end of PPQ. This assessment will typically be a graphical, risk-based evaluation of the PPQ batch-to-batch variability in the context of the specifications. Again, the purpose of this evaluation is to give an initial risk assessment of the reproducibility and capability of the packaging process, recognizing that the full assessment will come after the initial period of routine manufacturing (Stage 3.1). The question to be answered is how confident is one that the next batch will produce acceptable packaging.
8 Continued Process Verification
CPV is a regulatory expectation to ensure that the validated process remains in a validated state 2. Within the context of the lifecycle approach to process validation, however, CPV is more than merely a compliance exercise; rather, it is an enabler of continued process understanding and improvement. It should include the use of statistical methods, as recommended in regulatory guidances 2, 6, to monitor packaging quality attributes and process parameters. The PPQ assessment should conclude with a determination of what, if any, enhanced sampling (above routine sampling levels) is recommended during Stage 3 CPV, and for how many batches. Enhanced sampling may be continued for none, some, or all attributes following PPQ – to be determined based on a risk assessment that includes the statistical analyses of the PPQ data.
The purpose of the enhanced sampling is to provide additional evidence deemed necessary to demonstrate that the packaging process is capable of reproducible commercial manufacture. Once that evidence is available, the enhanced sampling is no longer required (even if Stage 3.1 is not yet complete). Companies ideally will have procedures specifying the use of a protocol for enhanced sampling during CPV; this protocol can allow for periodic evaluations to determine the appropriateness of reducing the level of sampling, specifying that the level of sampling may be reduced to routine levels when sufficient understanding of variability and demonstration of capability have been established. Procedures related to Stage 3 should also include provisions for increasing sampling if trending data indicates a change in within-batch variability.
Unlike a manufacturing process, the packaging process for OSD forms, especially for secondary packaging, is generally independent of the product. Thus, it is often more meaningful when trying to understand process performance to group packaging processes based on packaging technology, packaging lines, packaging format, or a combination of these. For example, all cold form blisters of the same size on a packaging line may be considered as a packaging process.
The attributes to be statistically trended in the CPV program should be selected using Quality Risk Management (QRM) tools and specified in a CPV plan (e.g., protocol or Standard Operating Procedure (SOP)). This plan should also address the statistical trending tools to be used, the frequency of data review, roles, and responsibilities, and events that trigger actions as well as what actions must be taken. These aspects are discussed in more detail below.
Key considerations for developing and implementing a CPV plan include:
- Results of the PPQ
- Extensiveness of the PPQ (configurations not tested during PPQ)
- Input variability included in PPQ (supplier batches, different suppliers)
- Interactions observed between process parameters and quality attributes during PPQ including worst case scenarios • Identifying packaging quality attributes, process parameters (PPs) and material attributes (MAs), and other process indicators to monitor per the residual risks at the end of PPQ
- Control strategy for the above mentioned attributes/parameters
Legacy processes typically enter the lifecycle in Stage 3. When implementing a CPV program for a legacy packaging process, information on the long-term behavior of the process (deviations, complaints) may also be used to highlight packaging quality attributes that should be included in the CPV program, including any for which enhanced sampling or more frequent monitoring is warranted for some period. For example, a high number of complaints received for under-filled bottles may identify the need to monitor that attribute more thoroughly within each batch or over multiple batches.
For a new packaging process, it may be necessary to continue monitoring some or all the attributes identified in the validation stage at the same level as during validation (or at a level above routine but lower than during validation). This enhanced monitoring is maintained until the process statistically demonstrates with high confidence a performance level justifying reduced monitoring.
A review of other, similar, packaging lines may also identify attributes that should be monitored during CPV.
The CPV monitoring plan should clearly state the AQL levels (or RQL levels, if performing enhanced monitoring) associated with each defect and the sampling plan to be used. Note that the sampling plan for routine packaging will be based on the AQL rather than the RQL used during PPQ.
Also, the CPV monitoring plan may be unique to a packaging line, and monitor all data collected from that packaging line, regardless of the product being packaged.
Note: For packaging, CPV is implemented for the packaging process or packaging line, independent of the product. It assumes that the packaging line has been suitably set up (i.e., right tooling, right controls) to package a specific product.
It is possible to not observe defects in the sampled units during routine inspections. This may be due to a small number of units inspected or as a result of culling the defects via automated inspections, for example, defective blisters ejected by a vision system. In this case, there is no packaging quality attribute data to trend (i.e., zero defects observed). Other attributes (process indicators) may be considered for monitoring:
- Number of rejected blisters or bottles
- Number of alarms during a batch
- Number of shutdowns during a batch
- Packaging yield
Although these attributes are not validated and do not have direct patient impact, they may be useful process indicators (like in-process controls in manufacturing) that point to a change in the state of control of the packaging process. Changes in these could trigger an evaluation and/or possible formal investigation based on risk assessment, and possibly, enhanced monitoring for a period.
The CPV protocol and/or company SOP(s) should allow for changing the attributes trended and/or the frequency of monitoring and/or level of sampling, based on accumulated process knowledge. The criteria for such changes should be clearly stated and any such changes should be made using a change control process.
Implementation of a CPV monitoring plan includes:
Data Collection
The data for CPV monitoring is collected for each packaging line, regardless of the product packaged, although it can also come from just one product. Data is collected from units sampled from a batch either during packaging or at the end of the run. The units may be sampled and inspected throughout the packaging run as part of the control strategy, or at the end of the run to determine batch disposition, or both.
The data is typically available as the number of defective units found per batch during inspection. For many packaging processes, it is not unusual to find few or no defects for many of the quality attributes during these sampling inspections. Or, when critical defects are observed, they become deviations and do not get trended. In such cases, it may be useful to adjust the unit of monitoring. For example, record time (or number of batches) between defects. If defects are seen to occur more frequently than in the past, this could indicate that the packaging process is no longer in a state of control.
Data Analysis and Reporting
Control Charts
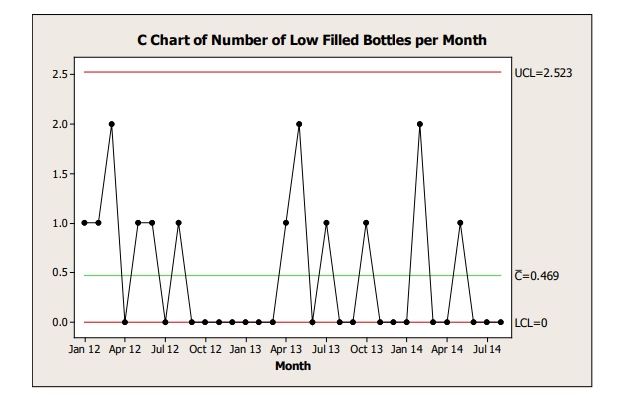
Many of the quality attributes monitored for packaging generate discrete data (counts). Appropriate control charts for monitoring such data in most cases are p-charts, c-charts, and u-charts. For attributes where the majority of the results are well above 0, a standard Shewhart chart can be used.
Control charts should be developed and interpreted with appropriate input from a statistician or someone trained in statistical methods. The frequency with which the control charts are reviewed should be determined based on the risk associated with the attribute being trended and clearly stated in the CPV plan. An example of a c-chart is shown in Figure 8.1.
Figure 8.1: Example C-Chart
Process Capability
Process capability of a packaging process may also be assessed by evaluating the number of defects observed over multiple batches. This may be done periodically, for example, once a year. An exact upper bound of a binomial distribution can be used to provide confidence in the true defect rate for the defect in the packaging process.
Table 8.1 provides an example of criteria used for assessing process capability over several batches. In this case, if the 95% upper bound for the observed defect rate is lower than the AQL, the packaging process may be considered highly capable.
| Defect Rate | Capability |
|---|---|
| Observed defect rate > AQL | Not capable |
| Observed defect rate < AQL, 75% upper bound > AQL | Marginally capable |
| 75% upper bound < AQL | Capable |
| 95% upper bound < AQL | Highly capable |
Table 8.2 provides some examples of process capability assessments using the criteria in Table 8.1. An AQL of 0.065% (often used for critical or Class I defects) is used. This assumes that zero (0) defects were observed during inspection.
| Number of Batches | Number of Samples Inspected per Batch | Total Number of Samples | 95% Upper Bound on Observed % Defectives | 75% Upper Bound on Observed % Defectives | Capability Assessment* |
|---|---|---|---|---|---|
| 30 | 200 | 6000 | 0.050 | - | Highly capable |
| 30 | 100 | 3000 | 0.100 | 0.046 | Capable |
| 30 | 60 | 1800 | 0.166 | 0.077 | Marginally Capable |
| 50 | 60 | 3000 | 0.100 | 0.0446 | Capable |
| 100 | 60 | 6000 | 0.050 | - | Highly capable |
* The assessment of capability depends on the number of samples inspected; as such, it simply represents the limit of what may be claimed by the sample inspected. For example, if 1800 units are inspected as above, only a marginal capability can be claimed based on the criteria defined. This does not necessarily imply that the process is marginally capable, only that it cannot be demonstrated any better with the data available. Additional samples per batch from additional batches are necessary to improve the assessment.
Table 8.2 shows that the packaging process defect rate is no greater than 0.050% based on 6000 samples taken across 30 batches with zero observed defective units; this represents a highly capable process, as this is within the AQL of 0.065%. Note that this is equivalent to saying that the RQL (associated with 95% confidence) is better than the AQL.
The CPV monitoring plan should be considered a living document and updated as needed, following change control procedures.
9 Conclusion
Drug packaging preserves the drug product quality by protecting it from the environment until it is used by the patient. Validation provides evidence that the packaging process is capable, consistent, and under control. Using the FDA’s Guidance for Industry on Process Validation 2 as the template, this paper offers ways to apply the lifecycle approach to the OSD forms packaging process. It includes the use of sampling plans, risk assessments, and the statistical analysis of Stage 2.2 results as part of a comprehensive PPQ evaluation, leading to the development of a living CPV plan.
This paper builds on a prior ISPE paper describing an overview of packaging validation 1. It is intended to generate further discussion and solicit feedback from industry with the goal of making it more useful.
11 Bracketing Examples
Example 1: Primary Packaging PPQ Bracketing – Number of Batches
In this example, the information in Table 11.1 is considered:
| Strength | 5mg | 10mg | 20mg | 40mg | 60mg |
|---|---|---|---|---|---|
| Capsule Size | 0 | 00 | 00 | 000 | 000 |
| Count/Bottle | 30 capsules in 50cc bottle | 30 capsules in 50cc bottle 60 capsules in 75cc bottle | 100 capsules in 75cc bottle | 100 capsules in 75cc bottle | 100 capsules in 75cc bottle |
| Closure | 33mm induction heat seal | 33mm induction heat seal | 33mm induction heat seal | 33mm induction heat seal | 33mm induction heat seal |
At a minimum, each strength must be included at some point during qualification and validation but not necessarily in PPQ. A holistic approach encompassing engineering, qualification, and PPQ packaging runs should be considered. The design of the pre-PPQ testing and qualification (number of units run, input variabilities included (e.g., multiple suppliers and batches)) and results (often with every unit evaluated to stricter criteria than used in PPQ) are significant factors in the justification of bracketing across strengths. Three runs are minimally required by most health authorities (the European Union 6 for example), with runs added to provide further assurance across additional input variabilities or to assure difficulties found during engineering or qualification runs have been resolved.
Assuming the results of qualification were acceptable and demonstrated robustness across input batches, packaging one PPQ batch of each capsule size could be justified. For variability not fully tested by the end of the PPQ exercise, heightened testing and monitoring of the associated attributes could be conducted during Stage 3.1.
If the use of vision systems is extensive or there are significant product-specific labeling differences, inclusion of at least one batch per strength may be warranted. It is not necessary to run a PPQ batch in each bottle size for the “00” capsule size if this was adequately covered in qualification prior to PPQ.
Example 2: Secondary Packaging PPQ Bracketing – Number of Batches.
In this example, the following is considered:
- 1 equipment set
- 2 product strengths
- 3 shifts
- 3 print formats (1, 2, 3 lines of text)
- Process interruptions
- Multiple material batches
Figure 11.1: Example PPQ Packaging Scenarios
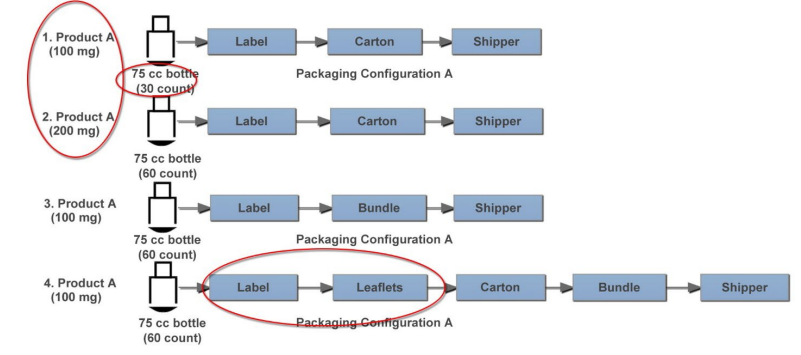
In this case, a packaging PPQ is designed for secondary packaging of two strengths of one product on a single packaging line. There are two different product counts but much more variability in secondary packaging process operations. While all configurations include labeling, cartoning, and shippers, some package configurations include leaflets and bundling.
A picture containing screenshot
Description automatically generated
It is not imperative to include all secondary packaging unit operations in the packaging PPQ. A holistic approach encompassing engineering, qualification, and PPQ packaging runs should be considered and the impact to both product and packaging quality attributes should be considered in the secondary packaging PPQ bracketing design. The design of the pre-PPQ testing and qualification (number of units run, input variabilities included (e.g., multiple suppliers and batches)) and results (often with every unit evaluated to stricter criteria than used in PPQ) are significant factors in the justification of bracketing across bottle sizes, counts, and secondary packaging unit operations. At a minimum three runs are required by most health authorities (the European Union 6 for example), with runs added to provide further assurance across additional input variabilities or to assure difficulties found during engineering or qualification runs have been resolved. Additionally, extended control strategy variables such as operating shifts, process interruptions and practices should be considered and included as appropriate.
Assuming the results of qualification were acceptable and demonstrated robustness across input batches, three batches may be appropriate for this secondary packaging PPQ, which could be accomplished with:
- One batch of Scenario 1/Configuration A, which has the lowest count
- One batch for Scenario 3/Configuration B, which includes bundling without cartons
- One batch of Scenario 4/Configuration C, which includes leaflets
While not shown in the diagram, additional consideration should be given to the configuration printing three lines of text (worst case). Some may prefer to repeat the worst case (likely Scenario 4) to compare the variability of results from identical product configurations. Results should be compared to PQ results, which begins the trending process. For variabilities not fully tested by the end of the PPQ exercise, heightened testing and monitoring can be conducted during Stage 3.1.
When bracketing, a PPQ execution matrix may be helpful in managing the PPQ. For packaging runs longer than one shift, inclusion of multiple shifts may occur naturally.
| PPQ Batch | Product Strength | Pkg Shift | Pkg Configuration | Lines of Text | |||||||
|---|---|---|---|---|---|---|---|---|---|---|---|
100 mg | 200 mg | 1 | 2 | 3 | A | B | C | 1 | 2 | 3 | |
| 1 | X | X | X | X | |||||||
| 2 | X | X | X | X | |||||||
| 3 | X | X | X | X | |||||||
Limitations and Liability
*The views expressed in this Discussion Paper by contributing authors represent their personal views and do not represent the official position of individual companies or regulatory authorities. This paper is not a regulatory guideline and the information in this paper does not reflect agreements among authors on content of process validation documentation.
Acknowledgments
By Authors: Maneesha Altekar [Lead] (AstraZeneca), Katherine Giacoletti (SynoloStats LLC), Edith Senderak (Johnson & Johnson Consumer Inc.), Tamar Ben-Avi (Taro Pharmaceutical Industries Ltd.), Milosz Kucinski (Novartis Technical Operations), and William Scherder (WJS)