Process Validation in Context of Small Molecule DS and DP Continuous Manufacturing Processes

This Discussion Paper discusses considerations for process validation (PV) activities with a specific focus on elements unique to continuous manufacturing processes. The intent is to acknowledge differences or additional considerations for continuous manufacturing processes without creating new definitions.
Continuous Manufacturing technologies have recently been implemented in the pharmaceutical industry for both process development, clinical trial and commercial supply. While the concepts of the process validation lifecycle can be applied to continuous processes, there are several unique aspects to be considered. This paper discusses these aspects as they relate to each stage of the PV lifecycle. Concepts including residence time distribution, state of control, disturbance detection, material diversion, process robustness metric, and approaches to ongoing process verification are discussed. Finally, a fictional case study is presented to illustrate the application of these concepts in an example process validation exercise. The author team is interested in receiving feedback on the continuous manufacturing topics presented, including lessons learned through regulatory agency feedback during review and inspection.
The paper may be modified or expanded sometime in the future to reflect additional input.
Please direct all feedback to pvpapers@ispe.org.
1 Introduction
This Discussion Paper discusses considerations for process validation (PV) activities with a specific focus on elements unique to continuous manufacturing processes. The intent is to acknowledge differences or additional considerations for continuous manufacturing processes without creating new definitions. In some cases, the concepts discussed in this paper may apply universally; however, the intended focus is on small molecule drug substances and drug products that leverage continuous manufacturing processes, whether for a new product development or post-launch conversion from batch to continuous manufacturing.
For clarity, some key definitions relating to PV for continuous manufacturing are:
- A Continuous Process is a process where, during normal operation, raw materials are continuously fed into the system at the same time as acceptable product is continuously removed from the system 1.
- The term Continuous Process Verification 2 refers to “an alternative approach to traditional process validation in which manufacturing process performance is continuously monitored and evaluated (ICH Q8).” Continuous process verification can be used in addition to, or instead of, traditional process validation.
The term Continuous Process Verification is not to be confused with the term Continued Process Verification, which is defined in Section 3. This paper will not focus on concepts associated with continuous process verification since it is not unique to continuous manufacturing; rather, attention will be called to a few Continuous Process Verification related aspects relevant to continuous manufacturing processes for illustration purposes.
- Continued Process Verification, assurance that the process remains in an ongoing state of control during routine production (Stage 3 in the FDA PV Guidance 3), is performed via the collection and evaluation of commercial batch data. Continued Process Verification is referred to as Ongoing Process Verification (OPV) throughout this paper to prevent confusion, and is also the term used in EU Annex 15 4.
The benefits of continuous manufacturing for pharmaceutical production include operational efficiencies, real-time quality monitoring, and product segregation for non-conforming material. The sample integration has the potential to be an efficient fit for continuous manufacturing processes.
Data collection and monitoring tools such as Process Analytical Technology (PAT) are used in traditional batch manufacturing and can also be applied for continuous manufacturing processes. The use of these tools enables the collection of large amounts of process and spectroscopic data that can be utilized for feedback and/or feed-forward control beyond the subsystem at which the data is acquired. Data can be collected continuously throughout manufacturing that can feed into process models; therefore, the detailed quality of the batch can be known.
With this high level of automation and real-time monitoring, small changes or shifts in the process are readily detected. thus, the statistical methodology and business processes for analyzing and trending data from a continuous manufacturing process may be different from those for a batch process.
This Discussion Paper consists of three sections that are aligned with the PV lifecycle approach stages, namely Stage 1 – Process Design, Stage 2 – Process Qualification, and Stage 3 – Ongoing Process Verification, with a focus on additional considerations needed during the development and validation of a continuous manufacturing process. A fictional case study is presented in the Appendix to provide additional context to the concepts described herein. The example is specific to a solid oral dosage form product; however, the concepts can be considered for other small molecule manufacturing processes.
2 Stage 1 – Process Design
In Stage 1 the commercial manufacturing process is defined based on knowledge gained through development and scale-up/scale-out activities. The control strategy is defined and refined to ensure that the process is ready to progress to Stage 2. One of the primary aims of Stage 1 is to develop a control strategy to make sure that the output consistently meets the expectations as described in the Quality Target Product Profile (QTPP). At a high level, the main science and risk-based steps completed in Stage 1 are the same for both batch and continuous manufacturing processes:
- Define QTPP
- Define/review product Critical Quality Attributes (CQAs)
- Define Critical Process Parameters (CPPs) that impact the CQAs
- Perform initial risk assessment of control strategy, linked to CQAs
- Execute studies (as applicable) and evaluate product/process data to understand relationships/interactions between process parameters and CQAs
- Develop/refine control strategy and process parameter ranges
- Perform final (residual) risk assessment of the control strategy; summarize the final control strategy and expected product performance based on data from Stage 1
Several unique considerations exist for the development of continuous processes. Continuous Manufacturing within a controlled and reproducible operation may have periods of process disturbance, for example, raw material feed rate fluctuations during process start-up. The potential for these disturbances should be considered and criteria developed to define and maintain the process in a state of control. When process performance is deemed outside its state of control, a process pause or a decision to isolate material can be engaged.
In continuous manufacturing processes, a disturbance in any unit operation can potentially affect the downstream unit operations. The response to disturbances should be a planned part of the control strategy and the ability to track and trace material must be understood as part of the pre-manufacture execution requirements.
A known process upset traveling through a continuous processing equipment set with a known residence time has a known dispersion and subsequently a known clearance time on return to normal conditions. Predictive models, including residence time distribution (RTD) models are useful for determining the amount of material that requires diversion 5.
If the magnitude and duration of the disturbance is known, a material management strategy for suitable isolation can be activated.
The preferred action to mitigate a process disturbance involves a process hold or isolation close to the point of detection. Using this strategy, a process disturbance that produces an excursion of known magnitude and duration can be managed with a planned response to maintain product quality. Management of material segregated from a continuous process deemed outside the state of control could include additional testing or data analysis in a similar manner to in-process decision making for batch manufacture.
Questions such as the stage of diversion in the manufacturing process, the impact on the quality of the material, whether and how to re-introduce the material, the registration requirements, and any PV requirements need to be considered. The response to a process disturbance can occur downstream of the process upset and can be manual or automatic depending upon practicality, timeframe, and the type of response.
As with batch manufacture, pausing a continuous process requires understanding of hold times, design and demonstration of the acceptable hold points, which for a continuous process could be the entire equipment set. The difference, however, is that the scope of subsystems affected by a process pause is at times greater for a continuous process due to the inherent integration of the subsystems.
On-line monitoring of process data and/or product data is vital to bringing the process back to target in order to minimize the impact of process drifts or disturbances that may otherwise result in product loss. Automated, real-time process adjustments to maintain the state of control are data-driven, which may leverage traditional batch-based process control loops, or tools such as PAT and process models. These aspects of the control strategy are designed to target the use of validated, robust tools during Stages 2 and 3 of the PV lifecycle. Using these data and controls, an observation of atypical trends can be used to modify the process back to target by adjusting input parameters when there is an understanding of the relationships between input and output. Science- and risk-based principles, along with statistical models based on experimental data, are used to develop this control strategy during Stage 1.
A common technique to monitor a continuous process relies on measurement of ongoing material mass balance where outputs are continually monitored versus inputs. In sequenced continuous manufacturing modules, the unit operation mass balance may require interface with the RTD model to arrive at an acceptable percent material accountability throughout the continuous manufacturing process. Tools such as PAT for monitoring a continuous process may also enable Real Time Release Testing (RTRT) 6 strategies.
Stage 1 development entails experimentation to develop understanding of the process dynamics required for integrated monitoring and control technology. Commercial equipment may be used for this development work, performing most Stage 1 experimentation at scale, eliminating the scale-up activities to assess process risks at the commercial scale required for traditional batch manufacture.
Although continuous processes may inherently reduce the need for equipment scale-up activities, it is important to note that since rate (mass per unit time) can become one of the scaling dimensions for a continuous process, there is a burden to characterize CQA performance and processing risks as a function of time/throughput rate (e.g., material build up on equipment surfaces). It is necessary to demonstrate control and understanding across the range from shortest to longest run time anticipated for commercial manufacturing. It may not always be possible to fully characterize a commercial time scale during Stage 1 and therefore this may be carried into Stage 2 as a residual risk.
During process development, consideration of primary stability should be evaluated. The concept of a 10% scale (and/or 100,000 units for drug product) stability batch may be cumbersome and not fit the paradigm of a product with a continuously manufactured flexible batch size. Demonstration that process stability and CQA performance are unchanged with scale, e.g., rate, while also justifying the representative chemical stability of the product manufactured is expected.
Spectroscopic tools such as PAT may be employed, requiring advanced chemometric and/or process models, and process automation often becomes a primary and integral aspect of the control strategy. RTRT strategies integrate these concepts. All of these aspects require a high level of understanding and teamwork from a cross-functional population of scientists - analytical scientists, equipment engineers, process engineers, automation engineers, statisticians, manufacturing technical scientists, manufacturing operational staff, Quality Assurance, and regulatory affairs, from both product development and manufacturing organizations.
Process robustness for a continuous process can be defined in a number of ways, for example mass balance, yield, or the percentage time the process remains in a state of control. The specific metrics employed will depend upon the process and control strategy implemented; optimizing process measurement tools for assessing process robustness will likely require significant run time experience in Stage 1.
As with a batch process, if the robustness of a continuous process is not adequate to attain the desired level of quality, then further Stage 1 development is required. Alternatively, reducing the complexity or the number of sequenced unit operations in the continuous manufacture train could be considered, or the introduction of surge capacity could be used as a control point.
The integrated continuous manufacturing process allows for process development studies to be executed in such a fashion that multiple different combinations of process conditions can be evaluated on a single development batch. Additionally, because process development for a continuous process is often at commercial scale on commercial equipment, and because of the high level of in-process sampling typically inherent to continuous processes, there may be greater opportunity to justify reducing the number of Stage 2.2 batches required in order to demonstrate the capability of the process and control strategy (although it is recognized that this approach may not be globally acceptable).
While inclusion of Stage 1 batches is possible, not all batches will be appropriate and one must demonstrate suitability. This could be achieved by 7:
- Taking the total number of Stage 2.2 batches determined through the residual risk assessment at the end of Stage 1 and subtracting those specified Stage 1 batches to be included, so that the total new batches needed for Stage 2.2 is reduced by the specified number of Stage 1 batches
- Using statistical methodology that explicitly incorporates Stage 1 performance information (e.g. Bayesian modeling) in the analysis of Stage 2.2 batches, thereby reducing the number of Stage 2.2 batches required for the same level of confidence
The main driver for including Stage 1 batches in Stage 2.2 is often the need for large numbers of batches if a formal analysis of inter-batch variability is planned. For reasons discussed in later sections, the preferred approach to the justification of the number of batches in Stage 2.2 is a risk-based assessment.
3 Stage 2 – Process Qualification
According to the Guidance for Industry: Process Validation from FDA 3 and EudraLex Annex 15 Qualification and Validation 4, the manufacturer is obliged to successfully complete Process Qualification (PQ) before commencing commercial distribution of the drug product. During the PQ stage of PV, the process design is evaluated to determine if it is capable of reproducible commercial manufacture. This stage has two elements:
- Design of the facility and qualification of the equipment and utilities (referred herein as Stage 2.1)
- PQ (referred to herein as Stage 2.2)
In general, Stage 2.1 comprises the same steps for both batch and continuous manufacture; however, the complexity of the qualification activity may be greater given the integrated nature of the unit operations, and if PAT and automated control and data management systems are utilized. Similarly, at a high level, the science and risk-based steps completed in Stage 2.2 are the same for both batch and continuous manufacturing processes:
- Author PQ protocol, which includes: • Defined acceptance criteria
- Number of batches to execute (including justification)
- Within-batch sampling plans (including any need for additional in-, at-, or off-line testing beyond routine levels)
- Sources of variability to include in the process verification exercise (e.g. starting material lots, hold times, process interruptions, etc.)
- Execute study - manufacture, sample, and test batches per protocol
- Analyze data and draw conclusions regarding confidence in-process capability, consistency, and reproducibility
- Author Summary Report, including recommendations for Stage 3.1a monitoring
Both batch and continuous manufacturing processes require development of process understanding and the use of risk assessments regarding process controls and process knowledge to develop the validation study design. As in batch manufacture, the continuous process risk assessment for the justification of the number of batches for Stage 2.2 relies on the data and knowledge generated during Stage 1. However, as with Stage 1, several unique considerations are present for planning and executing Stage 2.2 for continuous processes, which are the focus of this Section.
When justifying the number of validation batches, the desire for flexibility in batch size should be considered. A risk-based approach should be taken when determining whether the intended maximum run time (defined by time, number of units, mass of product, etc.) should be included in the PQ exercise. To do this, consideration should be given to product understanding, process knowledge, and detectability of unexpected performance in relation to the specific risks associated with increases in run time, that is, product, microbial growth, material build up/equipment performance, cleanability, etc.
Additionally, if multiple mass throughput rates are intended to be leveraged to give flexibility in commercial production, these should have been demonstrated in Stage 1. PQ would then be run at the target throughput rate, or alternatively (since different risks may be relevant depending on the module run speed) at multiple throughput rates, in the latter case a justified bracketing or matrix approach may be considered.
The number and lengths/sizes of executed lots are useful ways to measure manufacturing experience for a continuous process, which typically has an assigned batch number based on the batch definition for the given process. (For example, batches may be defined based on a time of collection, amount of product made from a specified quantity of raw materials, or amount of product at a defined rate of manufacture.) Each Stage 1 batch has an associated risk with respect to being representative of the final commercial process that must be considered in determining a Stage 1 batch’s relevance in assessing readiness for Stage 2.2.
In batch manufacture, the assessment of how relevant a Stage 1 batch is for the Stage 2.2 manufacturing process (considering, e.g., process changes, batch size, run duration) was discussed in a recent ISPE Discussion Paper 8. In continuous manufacturing, process development is often conducted using commercial scale equipment; thus, much of the development data is representative of the commercial process being validated in Stage 2.2, provided that the data is also representative of the final manufacturing control strategy.
The amount of manufactured material or the number of batches for Stage 2.2 PQ must be sufficient to show that the commercial process is reproducible and capable of consistently producing product meeting requirements at the commercial scale. While fewer than three PQ batches can in some cases be justified and considered consistent with guidance from some regulatory agencies – perhaps more in the case of continuous processes than batch processes, given the larger amount of development work done at commercial scale on commercial equipment - this may not be globally acceptable. The global supply strategy for a given product often needs to be considered during PQ and may dictate the number of batches. Based on market requirements, companies may choose to continue using at least three batches for the PQ exercise in Stage 2.2. In either case, Stage 2.2 will focus on intra-batch consistency and capability, leveraging the initial period of commercial manufacture to gain a better understanding of inter-batch variability.
The state of control concept as defined by ICH Q10 9 is applicable to continuous manufacturing processes:
A condition in which the set of controls consistently provides assurance of continued process performance and product quality.
The concept of state of control applies to all pharmaceutical manufacturing processes, and is not necessarily synonymous with steady state, which is defined as having limited variation with time for all the parameters and material attributes associated with the process 5. Criteria for establishing a state of control are dependent on the control strategy and the equipment employed. When the output quantity of a continuous process is based on run time or quantity, the state of control for the run time or quantity produced in a continuous process running on a qualified equipment set can be established.
Statistical process control (SPC) tools are appropriate for assessing the large volumes of data from continuous manufacturing processes and for predicting future results based on process history. Demonstrating that an in-control process is capable of consistently meeting specifications is an objective in Stage 2.2, and many of the same statistical methods applicable to Stage 2.2 for batch processes are applicable to continuous processes as well.
Continuous manufacture typically runs in an automated environment that is ideal for parametric and PAT process control, feedback loops or feed-forward loops to ensure the process is running within a state of control. There are circumstances where monitoring instruments such as a spectroscopic PAT system may not be available to perform testing measurements, for example, during instrument maintenance. Such circumstances should normally be planned in advance, but whether or not that is the case, redundancy of analytics, instruments, and/or back-up controls minimize the impact on manufacturing. Any such redundant or back-up systems must be qualified as part of validation of the control strategy.
Systems and equipment are qualified in Stage 2.1 and the effectiveness of the control strategy is confirmed in Stage 2.2. Material may be tracked through the system using qualified RTD techniques and if an adverse event occurs to upset the process state of control, a planned criterion to isolate and/or reject material is implemented to re-establish control. Testing and qualification of these failure mode systems as part of the overall control strategy before or during Stage 2.2 is needed, especially where an automated system and defined limits for the state of control are in place for the manufacturing process.
It is good practice to measure process performance metrics (i.e., yield, mass balance, etc.) in Stage 2.2 Performance Qualification; however, there need not be Performance Qualification acceptance criteria associated with these metrics. The robustness measurement techniques explored in Stage 1 such as mass balance, yield, and the percentage of time the process remains in a state of control from the planned product collection of the continuous processing batch would be appropriate. Preliminary alert limits and/or acceptance criteria for these types of measurements based on process development experience may be considered to enable monitoring of process performance beyond the CQAs. However, only once sufficient commercial scale batches have been manufactured (i.e., at the end of Stage 3.1) should more firm limits for process performance metrics be established.
As mentioned, the development scale equipment for many continuous manufacturing processes is the same as commercial scale. In such cases, some aspects of the control strategy may not need to be tested during Stage 2.2 analysis, such as an RTD model developed and qualified during Stage 1 if the process conditions have not changed that would affect the RTD model. A qualified RTD model developed during Stage 1 should be confirmed, however, during Stage 2.2 when this is not the case (e.g., the scale, equipment design, and mass throughput rate).
The length of a continuous manufacture campaign may be unique to the continuous process and require qualification. Changes to the RTD, campaign length, or maximum batch size should be assessed, and consider further confirmation such as through a single batch to supplement the original Performance Qualification. The understanding of material traceability and a demonstrated ability to appropriately isolate material must be assessed as part of the change to the RTD before commencing commercial manufacture.
While the concept of continuous manufacturing may currently be considered somewhat novel within the pharmaceutical industry and may in some cases be categorized as a non-standard process 2], there are a number of unit operations that have been in place for many years and are well understood that employ continuous operation principles, including tablet compression, roller compaction, centrifuges, and milling.
While product specific risk profiles should be developed for these types of established unit operations when included in a continuous manufacturing process, only those submodules that truly are novel need to be classified as non-standard. Additionally, elements that are inherent to the overarching continuous manufacturing train should be outlined. Specifically, the interactions between the unit operations should be emphasized, including aspects such as:
- Feedback control mechanisms that transition across individual unit operations
- Start/stop linkages and risks associated with these transient conditions
- Unique product intermediate transport processes
It is anticipated that continuous manufacturing processes will typically generate more in-process and perhaps finished product data than most traditional batch manufacturing operations; however, it is important that the scope of data that is directly tied to the manufacturing control strategy and/or product disposition be clearly defined. The Stage 2.2 statistical analyses and related sampling plans (i.e., defined sampling points and amounts used to support Stage 2.2 statistical analyses) will focus on the CQAs, CPPs, In-process Controls (IPCs), etc. relevant to assessing product quality and process control that were identified in the criticality analysis in Stage 1. Data acquired that are not used for these purposes should also be included in the overall CPP/CQA risk assessment.
Stage 2.2 planning includes determining the appropriate statistical analyses to demonstrate process control and capability during Stage 2.2, which in turn should consider the statistical analyses and tools to be used in routine production and monitoring/trending. Thus, a statistically-based sampling plan for Stage 2.2 is generally recommended to support the statistical analysis of Stage 2.2 data to provide assurance that the process is capable and consistent. This usually means a higher level/frequency of sampling in Stage 2.2 than routine, but where PAT and automatic diversion/feedback controls are used, as is often the case in continuous processes, the level of sampling already inherent to the control strategy may be sufficient. This needs to be evaluated and justified for each CQA, CPP, IPC, etc., as part of planning Stage 2.2.
Continuous Manufacturing processes inherently involve stratified sampling (especially for oral solid dosage products) for more parameters/quality attributes, at more locations throughout a batch, and with the potential for a higher sample size within each location than typical batch manufacturing. A continuous manufacturing process often involves in-line and at- or off-line sampling and testing, which should be part of a valid sampling plan if it is to be used to make inference and decisions to all or part of the batch, whether during Performance Qualification or commercial manufacturing. Example purposes of sampling plans include:
- Assessing process performance (Stage 2.2)
- Meeting regulatory and internal requirements for product disposition decisions
- Actively monitoring IPCs to ensure the manufacturing process maintains a state of control consistent with the intended control strategy
- Providing data to confirm bracketing periods if product diversion is employed (e.g., confirmation of diversion strategy during Stage 2.2)
As with batch processes, the selection of sampling points, frequency, and quantities for a continuous process should support (a) the control strategy developed after conclusion of Stage 1 for commercial manufacturing and (b) potentially expanded sampling during Stage 2.2 Performance Qualification and Stage 3 OPV to adequately demonstrate process capability and control, using quality risk management principles. Some particular considerations for continuous processes include:
- Amount of sampling during routine commercial manufacturing may inherently surpass the requirements for Stage 2.2 and Stage 3 (e.g., if on-line real-time testing is employed)
- Ease of implementation/use by site operations personnel (i.e., sampling should not be so complex that it is difficult to logistically execute)
- Cost to implement and/or product yield losses
- Process risk in the event sampling requires the process to operate differently from the traditional manufacturing process for the same product (e.g., weight control samples of the first layer of a bilayer tablet or the sampling frequency for determining the end of a continuous reaction)
Consistent with the PV lifecycle approach, more extensive sampling than routine commercial manufacturing/release testing levels may be needed to provide process understanding and statistical confidence in-process performance in Stage 1 and Stage 2. Sampling frequencies can be re-assessed immediately after Stage 2.2 or during Stage 3.1, and in some cases be reduced, once the reproducibility and capability of the process have been demonstrated. However, the routine level of sampling within a continuous manufacturing module may be sufficient such that no additional sampling is needed during Stage 2.2 (e.g., if automated feedback controls, PAT monitoring, real time release, etc. are utilized), and thus, no reduction would be made after Stage 2.2.
Sampling plans and statistical analyses of data from continuous manufacturing processes to assess process reproducibility and capability often use advanced statistical methodologies when much larger volumes of data are generated (e.g., by PAT methods) for certain CQAs or IPCs. In such cases the structure of the data collected (e.g., systematic or nested samples associated with solid dosage uniformity testing) may also dictate more advanced statistical modeling in order to accurately describe process performance and capability.
Higher sample sizes and frequencies within each continuous manufacturing batch may increase the risk of falsely rejecting acceptable batches (the producer’s risk) using simple acceptance sampling techniques. Therefore, it is highly recommended that appropriate statistical modeling techniques be employed, not only in assessing capability in the analysis of Stage 2.2 batches, but also in developing a sampling plan for routine batch control and release.
The use of advanced statistics to design a sampling plan does not mean that the sampling plan need be complicated to implement. For example, sampling plans can be designed and justified using simple statistics such as the mean and standard deviation of a sample to make disposition decisions for all or part of a batch. In order for such a sampling plan to be valid and justified, its operating characteristics (probability of wrongly accepting/rejecting product) should be clearly understood and documented.
The evaluation of the data from the Stage 2.2 (and any relevant Stage 1) batches is performed with the same objectives as for a batch process: assessment of intra-batch variability and capability and initial assessments of reproducibility and consistency between batches. Based on these assessments, decisions are made regarding the readiness of the process to proceed to Stage 3, whether and to what degree enhanced sampling (i.e., sampling frequencies and/or amounts greater than routine) are needed in Stage 3, and if so for how many batches before another evaluation is made. Keeping in mind the special considerations for PAT, etc., and related implications for statistical methodologies for continuous processes discussed above, the Stage 2.2 performance evaluation is not substantially different than that for a batch process.
4 Stage 3 – Ongoing Process Verification (OPV)
The goals and expectations for OPV are summarized in the FDA’s 2011 Guidance for Industry Process Validation: General Principles and Practices3 and within EudraLex Annex 15 Qualification and Validation 4, and are the same for batch and continuous manufacturing processes: to provide ongoing assurance that the process remains in a state of control by monitoring it through a periodic trending program.
This stage of the PV lifecycle facilitates opportunity for early intervention/implementation of preventive actions if a process performance shift is identified; however, there are several special considerations for continuous manufacturing processes. The amount of data that may be routinely captured for a continuous manufacturing process makes it important that the trend analysis focus on the critical parameters that are predictive of product quality (e.g., control strategy parameter criticality, IPCs).
Numerous parameters may be measured in a typical continuous manufacturing process that have no impact on the quality of the material being produced, but are required based on the system automation capabilities. The process measurements to be statistically trended in the OPV program should be selected using quality risk management tools and specified in an OPV plan. The OPV plan should also address the statistical trending tools to be used, the frequency of data review, duration of data collection, roles and responsibilities, and events that trigger actions as well as the actions that must be taken.
In determining which CQAs, CPPs, IPCs, etc., to include in OPV monitoring for any process, it is important to consider the impact of the control strategy. If a parameter is sufficiently controlled via automated systems that it cannot vary beyond acceptable levels, then there may be limited value in trending those values using control charts. The decision for each potential measurement should take this into account, in addition to any anticipated benefits in terms of better process understanding via periodic trending of process data/product quality attributes. It could be that in some cases, no trending will be the optimal choice, while in others simply reducing the frequency of monitoring may be preferred in order to continue to gain additional understanding. Furthermore, with a process that incorporates automatic controls and/or RTRT, measures such as frequency of adjustments or diversions may be of interest for OPV monitoring, as indications of process stability.
When selecting process trending tools to monitor a continuous manufacturing process, consider the following:
- For parameters in scope of OPV, there can be hundreds of assessments per parameter or IPC during routine manufacture of a batch; therefore, there should be consistency in excursion handling between Stage 2.2 and OPV. Stage 2.2 execution demonstrates the robustness of a process; however, it is to be acknowledged that Stage 1 and Stage 2.2 Performance Qualification may not have assessed all sources of variability that will be experienced during the lifecycle of the product (e.g., raw material variability).
- OPV should capitalize on the additional data generated and a periodic refinement of the control strategy. For example, total number/mass of segregation events specified during Stage 2.2 should be re-assessed to provide an appropriate signal when there is abnormal performance of a batch. This would provide an opportunity to determine root cause and further increase the knowledge base of the product, with the optimal goal of minimizing/eliminating the need for segregation events.
- Continuous Manufacturing processes can be amenable to Continuous Process Verification (see Section 1) for some product quality attributes. A hybrid approach may be considered for those variables that would follow a more traditional OPV approach. If RTRT is used, Quality systems should be designed to take advantage of the real time release benefits while still formally reviewing the robustness of the process on a set frequency. This review would determine if there are any adverse shifts/trends compared to the initial validation. Shifts and/or trends may happen without adverse impact, but the expectation is that these process signals are acknowledged and understood why there was non-random behavior.
The goals of OPV are to:
- Understand routine variability
- Detect unusual variability
- Enable process improvement to maintain a state of control
Some statistical tools suited to meet the goals of OPV can be from the field of SPC, and are relatively simple to understand and use, primarily control charts and capability analyses. There are some crucial differences, however, between the textbook application of control charts and capability analyses to the types of processes for which they were originally developed and their application in pharmaceutical processes. For example, the focus on rapid reaction to small shifts in most SPC examples assumes that control chart monitoring and trending is done in real time.
For continuous manufacturing employing tools such as PAT for real-time measurements and adjustments, the sensitivity of control charts that are to be reviewed retrospectively to small process shifts may be less relevant if the process automatically adjusts in real time via feed-forward or feedback control. This implies that the objectives of trending using SPC tools can be different for continuous processes employing automated, real-time control; those objectives should be clearly understood prior to defining the OPV program. For example, while there is little value in choosing control charts to be sensitive to small shifts in the context of automated process control and retrospective review of charts, there may be quite a lot of interest in review of average performance over time to look for larger drifts, and in trending process performance measures as noted above.
Successful implementation of OPV, particularly in the context of continuous manufacturing, requires that companies be mindful of the goals of an OPV program and these differences from textbook SPC when designing an OPV program and associated procedures.
With these goals in mind, it is recommended that the simplest control charts possible be used for periodic trending in order to maximize utilization by those with the greatest process and product knowledge. While that is true for any process, the stratified sampling utilized for many, if not all, parameters trended in a continuous manufacturing process may necessitate using different charts than in processes where one measurement per batch is made at release.
Specifically, for a CQA that is tested using a stratified sampling plan, a Three-Way chart, also called an I-MR-R/S or Between/Within chart, is recommended. An example is given in Figure 4.1.
Figure 1: Example Three-Way Chart
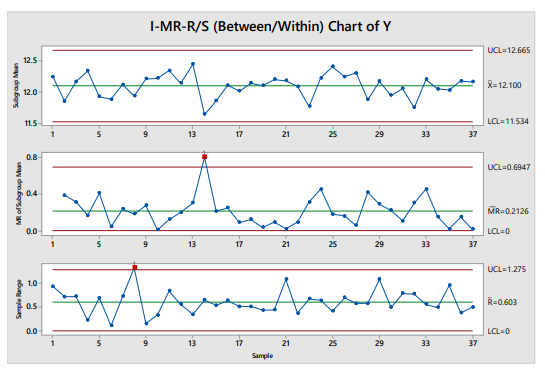
The I-MR-R/S chart consists of three panels:
- The top panel shows the means of the samples (i.e., mean of individual measurements at each sampling location)
- The middle panel shows the moving range of location means (the differences between two consecutive means from the top chart), a measure of sample-to-sample variability
- The bottom panel shows the within-location variability (range or standard deviation), a measure of the within-sample variability.
The control limits for the mean are calculated using the moving range of the sample means. Failure to separately account for the between- and within-location variability in stratified samples can lead to underestimating the variability, which in turn causes overly narrow control limits and subsequent unnecessary effort responding to out-of-control points. This is illustrated in Figure 4.2, which shows the same data plotted on a simple x̅-R chart, in which the control limits are calculated using the within-sample standard deviation.
Figure 2: Example x̅-R Chart
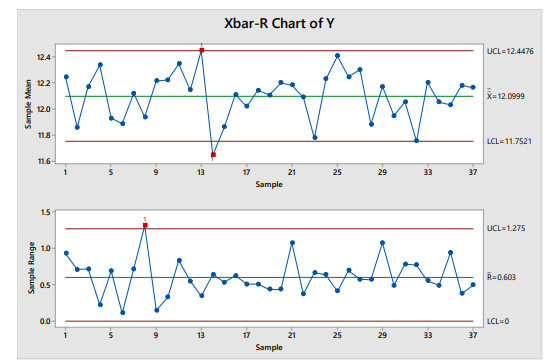
While the I-MR-R/S chart accounts for the two sources of variability in the data, and is therefore preferable to the x̅-R chart, it may in fact over-estimate the expected variability of the subgroup means in some cases. If more precise control limits are required to meet the OPV objectives, advanced modeling techniques can be used (e.g., Bayesian methods). The level of expertise and effort required, however, may not often be worthwhile if the over-estimation of variability for a continuous manufacturing process is not so great as to detract from the value of the OPV program.
The suggestions above for specific control charts and advanced methods for accounting for hierarchical variability sources (e.g., stratified sampling of individual units within locations within batches) in calculating capability do not fix the violations of the assumptions of randomness and/or independence that frequently arise in measurements from pharmaceutical processes.
For example, the usual interpretation of run rules, such as 9 or more points on the same side of the mean or 6 or more points in a row increasing/decreasing, relies on assumptions of independence and randomness of the data that are almost never true for pharmaceutical process data. These assumptions, and the impact of their violations on control charts and capability analyses, are discussed in detail by numerous authors 10, 11.
Examples of the causes of these assumption violations in pharmaceutical processes (including continuous manufacturing processes) are:
- IPCs (measurements from earlier in a process used to adjust the process, and therefore not independent of measurements later in the process)
- Raw material and seasonal variations (groups of batches from the same raw material lots, produced in the same season, etc.)
- Batching of at-/off-line analytical testing.
Therefore, just as for traditional batch processes, it is crucial to the successful implementation of an OPV program for a continuous manufacturing process that:
- Personnel involved in using and interpreting the charts and capability analyses understand the impact of the frequent violations of key assumptions for these tools in pharmaceutical process data on their interpretation
- Business processes for actions to be taken in response to statistical signals are risk-based and appropriate in light of knowledge of the process/product and these same violations of assumptions for the statistical tools 12
Other considerations when designing an OPV program for a continuous manufacturing process include model maintenance, which is an additional requirement often associated with continuous manufacturing processes that utilize technology such as PAT. Process models (such as an RTD), PAT models, and others supporting RTRT require a model maintenance plan based upon their respective risks and role within the control strategy.
5 Conclusion
Process Validation in the context of continuous manufacturing is fundamentally the same concept as for batch processes. A lifecycle approach consisting of three stages (Process Design, Qualification, and Monitoring) forms the basis of the approach. However, due to the linking of multiple unit operations in continuous manufacturing processes that may have an increased volume of data, integration of process models and tools such as PAT for feedback/feed-forward controls, as well as the implementation of RTRT strategies, there are still refinement opportunities that will require further consideration as industry continues implementation.
6 Appendix: Case Study (Fictional)
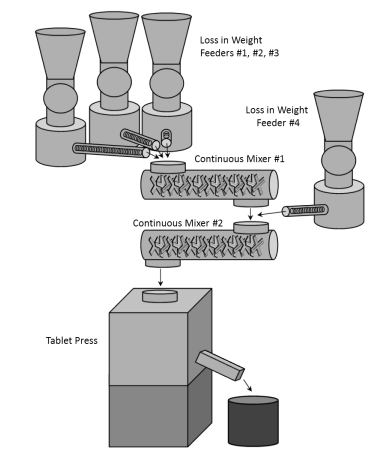
Continuous Manufacturing processes involve the incorporation of multiple process steps into a single, typically highly automated, integrated system. An example of a continuous manufacturing module is depicted in Figure 6.1, a direct compression module that produces non-sterile solid oral dosage tablets. The module integrates the following subsystems:
- Loss in Weight Feeders #1, #2, #3 – Three independent loss in weight feeders meter dry powder formulation ingredients into a continuous mixer (Continuous Mixer #1)
- Continuous Mixer #1 – Mixes the three ingredients fed from the upstream loss in weight feeders
- Loss in Weight Feeder #4 – Adds a fourth dry powder formulation ingredient into the system post Continuous Mixer #1
- Continuous Mixer #2 – Mixes the final formulation and continuously delivers powder to a tablet press
- Tablet Press – Compresses the final blended powder into the dosage units
The example is specific to a solid oral dosage form; however, the concepts can be considered for other small molecule manufacturing processes.
Figure 3: Example of a Continuous Manufacturing Module (Solid Oral Dosage Application)
6.1 Stage 1 – Process Design
Design and demonstration of the robust flow of materials throughout the continuous manufacturing process is necessary in Stage 1 to establish that the process is ready for Stage 2.2 Process Qualification/Validation. Some example elements relevant to Stage 1 for the continuous process-specific concepts are described for this case study:
Initial Control Strategy Design Phase
CQAs of the tablet dosage form are defined independently of the manufacturing process modality (i.e., regardless of whether a continuous or batch process is used), based on the QTPP. For example, meeting uniformity of dosage units requirements is one example CQA (and its requirement) associated with the QTPP element for consistent dose delivery.
Preliminary feasibility experiments were conducted in developing an RTD model to understand the effect of process inputs and settings, including throughput rate, formulation ingredient physicochemical properties, mixer speeds, and tablet press speed. The RTD model determined the timescales involved for the potential material diversion location, in this case the tablet press ejection chute. For example, studies revealed that tablet dose uniformity for this formulation was sensitive to total throughput. Specifically, tablet dose uniformity was adversely affected as throughput increased.
Control Strategy Refinement Phase
With the knowledge gained following execution of the preliminary feasibility experiments, a maximum throughput rate was evaluated during subsequent experimentation. A development team also assessed inherent process disturbances that are anticipated to occur, such as process pauses (i.e., stopping the loss in weight feeders, both continuous mixers, and the tablet press).
Experimental development runs revealed that this idle period increased tablet dose variability, that is, decreased uniformity. To mitigate this effect, a diversion period at the tablet compression unit operation for a specific amount of time (based on the product throughput rate and RTD) was added to the control strategy following a process pause. This ensures process control and consistent quality of product intended for release.
During PQ execution, these inherent process stoppages will be captured and evaluated with respect to processing consistency.
Residual Process Risk to Evaluate during Stage 2.2
In the present example, a risk that was deemed sufficiently low for commercial manufacture based on process understanding, but still needed to be confirmed during Stage 2.2, was the maximum run time for routine manufacture with respect to uniformity of dosage units. Findings that supported this risk level during Stage 1 included:
- There were no material build up risks based on qualitative assessment of the equipment after each development batch execution (maximum run time was 500 kg of a product surrogate).
- No adverse trends in CQA data were observed versus run time. The product is known to be physically and chemically stable based on environmental stress condition studies.
- Each process pause did not result in a cumulative effect that would necessitate a modification to the RTD model (i.e., the RTD model confirmed that each pause/disturbance was independent of each other). Therefore, the predicted total number of process pauses anticipated during routine manufacture with the longer run time was not expected to be a high risk.
Based on this data, it was deemed low risk to target a 1,000 kg maximum batch size during Stage 2.2.
6.2 Stage 2 – PQ
Using the knowledge accumulated during Stage 1 and the residual risk assessment, the elements relevant to Stage 2.2 for the continuous process-specific concepts discussed were explored:
- The continuous process being validated was associated with a batch to continuous process conversion. The batch process applied PAT concepts associated with some of the product CQAs (e.g., Near-IR for tablet dose uniformity). Based on this experience with the batch process, it was justified that traditional wet chemistry methods would not be required for these CQAs. In addition, it was determined that the inherent sampling frequency via a PAT measurement during batch production exceeded the minimum level of sampling to make appropriate statistical conclusions. The previously validated PAT methods were used for the sampling employed during Stage 2.2 for the continuous PQ. The remaining CQAs utilized traditional wet chemistry methods.
Stage 1 process performance results were analyzed to determine the required number of batches for Stage 2.2. It was concluded that a single throughput rate of 25 kg/hr would be validated for the routine commercial process, which does not approach the process sensitivity to unit dose uniformity observed during Stage 1. This single target was selected to simplify the Stage 2 PV study design while allowing sufficient manufacturing operations flexibility, enabled by varying the total run time of the module. The specific markets in scope of this product did not require a minimum number of PQ batches.
Of the 12 Stage 1 development batches manufactured, 5 batches were manufactured at a throughput of 25 kg/hr. Therefore, these 5 batches were used to evaluate the risk of each CQA in the context of the Stage 2 study scope. The risk analysis deemed all CQAs to have a low risk of failure at this throughput rate.
Based on this evaluation, the study design included a bracketing approach for minimum and maximum batch size via 2 batches (totaling 7 batches, which would be evaluated for initial between batch variation analysis):
Batch 1 – This batch was manufactured to verify the longest run time of 40 hours (target: 25 kg/hr x 40 hrs = 1,000 kg) of the module prior to clean-up and change-over. While there were no specific product build up/degradation risks identified during process development, the residual risk assessment recognized that the module never experienced this run time, and therefore it was included in Stage 2.2.
Including a total run time in Stage 2.2 that was not run in Stage 1 was considered appropriate due to robust Stage 1 data, including RTD model qualification, indicating a very low risk of unacceptable unit dosage uniformity (otherwise, in general, it is not recommended to experiment in Stage 2.2). The longer run time also allowed for demonstration of the control strategy for inherent process stoppages that require process restarts due to idle periods during off-shifts.
This larger batch included multiple drug substance lots to verify that no significant process upsets occurred during new lot introduction into the system. Again, process understanding from Stage 1 indicated a very low risk due to variation in drug substance lots, so the objective of including multiple lots in Stage 2.2 was simply to confirm this.
- Batch 2 – This batch was manufactured to verify the shortest run time on the module of 1 hour (target: 25 kg/hr x 1 hr = 25 kg). Testing was focused on the aspects of a process that would be relevant to a shorter run time, specifically yield related to how rapidly steady state is achieved. Process pauses were not purposely introduced since this was adequately assessed via Batch 1.
- The RTD model developed during Stage 1 was utilized during Stage 2.2 since the equipment design and formulation characteristics did not change. A confirmation of the RTD model was deemed unnecessary during Stage 2.2 since several development batches were manufactured at a throughput of 25 kg/hr and deemed representative of the commercial process.
Post execution of Stage 2.2, a cross-functional team comprised of technical operations, a statistician, and Quality Operations was formed to perform a risk assessment of the Stage 2.2 performance to determine the sampling and monitoring approach for the initial part of OPV (sometimes referred to as “Stage 3.1”).
It was determined that, based on the data and process understanding achieved through Stage 2.2, there was a high degree of confidence in the process to produce tablets meeting the defined uniformity of dosage units (UDU) requirements.
Since UDU is controlled via in-line PAT testing and automated feedback controls verified during Stage 2.2, the team decided not to include this CQA in periodic OPV evaluations and reports, but to assess it in the annual product review. Other CQAs, CPPs, and process robustness metrics (e.g., tablet dissolution, frequency of diversion, yield) were included in scope of OPV reporting in order to increase process understanding, particularly batch-to-batch variability, and to expand the knowledge of process sensitivities.
- Based on the successful manufacture of Batches 1 and 2, the validated commercial batch size range was 25-1000 kg.
6.3 Stage 3 – OPV
The OPV plan was implemented post Stage 2 execution and the remaining medium risk product quality attributes and process parameters were included in scope of monitoring. (Low risk items were removed from scope and formally assessed as part of the annual product review.)
The first OPV reporting period was targeted after multiple lots of excipients and drug substances were used, multiple module clean-up/changeovers executed, and included production periods from all available manufacturing shifts.
Based on the commercial production plan, an appropriate timeframe for the first OPV report would be after three months of commercial manufacturing. For this case study, this assumes that the three months of routine production resulted in 50 batches manufactured (of varying run times/batch sizes, production shifts). The elements relevant to Stage 3 for the continuous process-specific concepts discussed are explored:
- Process yields for the 50 batches were analyzed and a refined process robustness alert limit was formally updated in the shop floor documentation. This signal can be further refined as appropriate over the course of the product lifecycle.
- Preliminary capability indices and SPC limits were calculated for the CQAs amenable to statistical evaluation and in scope of OPV with traditional trending, based on the 50 batches manufactured.
- These capability assessments and control limits were considered preliminary because, although the number of batches was large (well over the minimum of 25-30 recommended for control limits), it was recognized that in the period of only three months not all sources of variability impacting the process over the long term will have been included in the data set. Thus, the control limits may be overly narrow.
- Identifying these as preliminary limits implies that points outside of control will be treated as potentially out of control, and reaction to them will be based on an evaluation of risk (risk of exceeding a specification limit) and process understanding with respect to the measurement in question.
After a year of routine manufacturing, including well over 100 batches, a formal capability analysis was performed and static control limits were calculated for those parameters in scope of OPV with traditional trending.
An additional year after these control limits were established, an out-of-control limits (but within release specification) result was observed for tablet dissolution. Although the result was within specifications, it was far enough outside of the control limits that a study was initiated to understand the cause. Based on that engineering study, it was determined that the current mixing parameter setpoint on Continuous Mixer #2 exacerbated a new process sensitivity associated with a raw material attribute previously not observed in Stages 1 or 2.2.
A development run was executed to verify the RTD model at new blender settings (i.e., event-driven RTD model verification scenario) and additional controls were installed because of the new knowledge gained regarding the raw material attribute studied. Based on this corrective action, a new Stage 2.2 study was conducted to verify the updated control strategy and product performance with the revised mixer setpoint.
The OPV plan was updated to re-evaluate performance after the first few batches with enhanced sampling employed and, if performance is deemed acceptable and low risk, to drop to routine sampling levels and evaluate control charts again after the next 20 batches (approximately one month of production) to provide additional oversight in the near term.
Limitations of Liability
*The views expressed in this Discussion Paper by contributing authors represent their personal views and do not represent the official position of individual companies or regulatory authorities. This paper is not a regulatory guideline and the information in this paper does not reflect agreements among authors on content of process validation documentation.
Acknowledgements
Carly Evans (Akebia Therapeutics)
Katherine Giacoletti, (SynoloStats LLC)
Declan Hurley (Lilly)
Robert Ievers [Co-Lead] (Merck)
Matthew McMenamin (GSK)
Jonathan Wade [Co-Lead] (Lilly)