Technical
September / October 2022

Novel Dry Decontamination Method Using Gaseous Chlorine Dioxide

Mark A. Czarneski
Figure 1: Oxygen piping system decontamination connections.

Chlorine dioxide has been shown effective in decontaminating various types of chambers and volumes such as rooms, isolators, processing tanks, and entire facilities, but its use to decontaminate compressed gas piping systems has not been documented. This article discusses using dry gaseous chlorine dioxide (ClO2) to decontaminate an oxygen (O2) feed piping system in a pharmaceutical research laboratory and shows that a dry gas can be used to remediate a contaminated piping system.

Bacillus species are Gram-positive, endospore-forming, rod-shaped bacteria found in soil, air, dust, and debris that are quite common in the natural environment. Endospore-forming microorganisms have been found to make up between 5% and 10% of the microflora in a standard cleanroom.1 Most of these bacteria are considered nonpathogenic and are commonly found in the dust and air of occupied buildings, including cleanrooms. They can enter cleanrooms through poorly filtered air, on clothing, and on incoming materials. Only one endospore is formed per cell and these spores are resistant to heat, cold, radiation, desiccation, and disinfectants, making it difficult to eliminate them from medical and pharmaceutical materials. Because of this, they are a frequent cause of cleanroom contamination.

One option to remove such contamination is to flush the system with a liquid sterilant such as hydrogen peroxide or liquid chlorine dioxide. Both are known to be effective at killing organisms and to kill bacillus spores. Using a liquid sterilant is considered unfavorable because it will introduce moisture into the system; this moisture might linger in the system in dead legs and low areas of piping and can potentially harbor future contaminations. To avoid this, gaseous chlorine dioxide was chosen as the agent because it is a dry gas and can be applied as a dry gas.

Chlorine Dioxide

Chlorine dioxide has been shown to be effective at eliminating viruses,2 fungi,3   bacteria,4 ,5   and spores.6 ,7   It has demonstrated inactivation of various toxins and chemicals such as beta lactam,8   anthrax toxins,9   endotoxins,10   pinworm eggs,11 ,12   and bed bugs.13 Chlorine dioxide has demonstrated bacillus spore log reductions in various applications such as rooms,14 ,15 suites of rooms,16   isolators,17 ,18   tanks,19   electron microscopes,20   ambulances,21   biological safety cabinets,22   and whole buildings and facilities.23 ,24 ,25 With all these applications, the question still remains: Can it be used to decontaminate piping systems with multiple drops and/or dead legs?

Chlorine dioxide can be generated by various methods and chemical equations. It is not a stable molecule that can be created, bottled, and shipped, so it is typically generated at the point of use. Most chlorine dioxide is generated in solution using acids, sodium chlorite, and water. When it is generated in solution, acidic byproducts that can be aggressive to materials are created. It can also be generated as a dry gas with no byproducts, which allows many materials to be treated with chlorine dioxide with few to no issues.

Chlorine Dioxide Gas Effects

Chlorine dioxide gas has varying effects on materials. In a study,26   several materials were exposed to two cycles of chlorine dioxide gas under vacuum pressure, with 75% relative humidity (RH) and a dosage of 3,350 parts per million (ppm)-hours. The final dosage after two runs was 6,700 ppm-hours. There was no effect on 18-8 or 316 stainless, black oxide, or zinc-plated steel; Buna-N, SBR Black, EPDM, or Viton rubber; PFA, PLGA, PVA, PGA, or liquid crystal polymers; aluminum or zirconium oxide; ETFE or FEP plastic; or vinyl or oil-resistant vinyl (black). There was no effect on aluminum, brass, cellulose ester, copper, epichlorohydrin, gold, Hypalon, magnesium, neoprene, nickel, Nitinol, nylon 6/6, polyglycolides, polyacetals, polylactides, polyester, polyimides, polyketones, polyurethane, Santoprene, silica, or silicone.

There were color changes to butyl, cellulose, cellulose acetate butyrate, fiberglass, latex, natural gum rubber, polyacrylates, and PVF. The following showed color changes and signs of physical changes such as oxidation and pitting: bronze, galvanized malleable iron, nickel copper, silver, and titanium. The material most adversely affected by chlorine dioxide was sorbothane, which demonstrated some disintegration and became very sticky and gummy after the final dosage.26


  • 1Sandle, T. “A Review of Cleanroom Microflora: Types, Trends, and Patterns.” PDA Journal of Pharmaceutical Science and Technology 65, no. 4 (2012): 392–403.
  • 2Olivieri, V. P., F. S. Hauchman, C. I. Noss, et al. “Mode of Action of Chlorine Dioxide on Selected Viruses.” In Water Chlorination Chemistry: Environmental Impact and Health Effects, Vol. 5. Edited by R. L. Jolley, 619–34. Chelsea, MI: Lewis Publishers, 1985.
  • 3Bundgaard-Nielsen, K., and P. V. Nielsen. “Fungicidal Effect of 15 Disinfectants Against 25 Fungal Contaminants Commonly Found in Bread and Cheese Manufacturing.” Journal of Food Protection 59, no. 3 (March 1996): 268–75.
  • 4Roller, S. D., V. P. Olivieri, and K. Kawata. “Mode of Bacterial Inactivation by Chlorine Dioxide.” Water Research 14, no. 6 (1980): 635–42.
  • 5Han, Y., R. H. Linton, S. S. Nielsen, and P. E. Nelson. “Reduction of Listeria Monocytogenes on Green Peppers (Capsicum Annuum L.) by Gaseous and Aqueous Chlorine Dioxide and Water Washing and Its Growth at 7°C.” Journal of Food Protection 64, no. 11 (November 2001): 1730–8.
  • 6Rosenblatt, D. H., A. A. Rosenblatt, and J. E. Knapp. Use of Chlorine Dioxide as a Chemosterilizing Agent. U.S. Patent 4 504 442. 1985.
  • 7Jeng, D. K., and A. G. Woodworth. “Chlorine Dioxide Sterilization Under Square-Wave Conditions.” Applied and Environmental Microbiology 56, no. 2 (February 1990a): 514–9.
  • 8Lorcheim, K. “Chlorine Dioxide Gas Inactivation of Beta-Lactams.” Applied Biosafety: Journal of the American Biological Safety Association 16, no. 1 (2011): 34–43.
  • 9Gordon, D., J. Krishnan, and S. Theriault. Inactivation Studies of Lipopolysaccharide and Anthrax Toxins Using Gaseous Decontamination Methods. Paper presented at Canadian Biosafety Symposium, Halifax, Canada. 31 May–2 June 2009.
  • 10Czarneski, M. A., P. Lorcheim, S. Drummond, and T. Kremer. “Endotoxin Reduction by Chlorine Dioxide (ClO2) Gas.” Kilmer Conference 2019, Dublin Ireland. 3–6 June 2019.
  • 11Czarra, J. A., J. K. Adams, C. L. Carter, W. A. Hill, and P. N. Coan. “Exposure to Chlorine Dioxide Gas for 4 Hours Renders Syphacia Ova Nonviable.” Journal of the American Association for Laboratory Animal Science 53, no. 4 (July 2014): 364–7.
  • 12Cole, B., and M. A. Czarneski. “Multiple-Staged Site Remediation of a Medical Research Animal Facility Affected by a Rodent Pinworm Infestation.” Association of Biosafety for Australia & New Zealand 5th Annual Conference, Canberra, QT. 9–13 November 2015.
  • 13Gibbs, S. G., J. J. Lowe, P. W. Smith, and A. L. Hewlett. “Gaseous Chlorine Dioxide as an Alternative for Bedbug Control.” Infection Control and Hospital Epidemiology 33, no. 5 (May 2012): 495–9.
  • 14Girouard, D. J., Jr., and M. A. Czarneski. “Room, Suite Scale, Class III Biological Safety Cabinet, and Sensitive Equipment Decontamination and Validation Using Gaseous Chlorine Dioxide.” Applied Biosafety: Journal of the American Biological Safety Association 21, no. 1 (2016): 34–44.
  • 15Leo, F., P. Poisson, C. S. Sinclair, and A. Tallentire. “Design, Development and Qualification of a Microbiological Challenge Facility to Assess the Effectiveness of BFS Aseptic Processing.” PDA Journal of Pharmaceutical Science and Technology 59, no. 1 (January–February 2005): 33–48.
  • 16Lowe, J. J., S. G. Gibbs, P. C. Iwen, and P. W. Smith. “A Case Study on Decontamination of a Biosafety Level-3 Laboratory and Associated Ductwork Within an Operational Building Using Gaseous Chlorine Dioxide.” Journal of Occupational and Environmental Hygiene 9, no. 12 (2012): D196–205.
  • 17Barbu, N., and R. Zwick. “Isolators Selection, Design, Decontamination, and Validation.” Pharmaceutical Engineering suppl. (August 2014): 6–14.
  • 18Czarneski, M. A., and P. Lorcheim. “Isolator Decontamination Using Chlorine Dioxide Gas.” Pharmaceutical Technology 4 (2005): 124–33.
  • 19Eylath, A. S., E. R. Madhogarhia, P. Lorcheim, et al. “Successful Sterilization Using Chlorine Dioxide Gas: Part Two-Cleaning Process Vessels.” BioProcess International 8 (2003b): 54–6.
  • 20Sherman, M. B., J. Trujillo, I. Leahy, D. Razmus, R. Dehate, P. Lorcheim, M. A. Czarneski, et al. “Construction and Organization of a BSL-3 Cryo-Electron Microscopy Laboratory at UTMB.” Journal of Structural Biology 181, no. 3 (March 2013): 223–33.
  • 21Lowe, J. J., A. L. Hewlett, P. C. Iwen, P. W. Smith, and S. G. Gibbs. “Evaluation of Ambulance Decontamination Using Gaseous Chlorine Dioxide.” Prehospital Emergency Care 17, no. 3 (July–September 2013b): 401–8.
  • 22Luftman, H. S., M. A. Regits, P. Lorcheim, K. Lorcheim, and D. Paznek. “Validation Study for the Use of Chlorine Dioxide Gas as a Decontaminant for Biological Safety Cabinets.” Applied Biosafety: Journal of the American Biological Safety Association 13, no. 4 (2008): 199–212.
  • 23Czarneski, M. A. “Microbial Decontamination of a 65-Room New Pharmaceutical Research Facility.” Applied Biosafety: Journal of the American Biological Safety Association 14, no. 2 (2009): 81–8. doi:10.1177/153567600901400206
  • 24Luftman, H. S., M. A. Regits, P. Lorcheim, M. A. Czarneski, T. Boyle, H. Aceto, B. Dallap, D. Munro, and K. Faylor. “Chlorine Dioxide Gas Decontamination of Large Animal Hospital Intensive and Neonatal Care Units.” Applied Biosafety: Journal of the American Biological Safety Association 11, no. 3 (2006): 144–54.
  • 25Takahashi, E., M. A. Czarneski, and A. Sugiura. “Japan’s RIKEN BSI: Whole Facility Chlorine Dioxide Gas Decontamination Approach for a Barrier Facility: A Case Study.” Applied Biosafety: Journal of the American Biological Safety Association 19, no. 4 (2014): 201–10.
  • 26 a b Czarneski, M. A. “Materials Testing with Chlorine Dioxide Gas Under Vacuum Conditions.” ClorDiSys Solutions, Inc., Report Number: R-21-1130. November 2021.
Figure 1: Oxygen piping system decontamination connections.

Decontaminating a System

An oxygen piping system was found to be contaminated with a bacillus strain of organisms at several point-of-service locations, thus requiring decontamination. The oxygen system was fed by an outside tank that feeds 39 points of service stations inside the laboratory. To decontaminate the oxygen system, gaseous chlorine dioxide was injected into the system at high concentrations, > 22 mg/L, and held for 30 minutes. The system was then flushed with oxygen gas to purge the chlorine dioxide gas. The process was successful, as determined by post-exposure swabbing that was found negative for any biological contaminates.

The chlorine dioxide gas generation process used for this process passes a low-level dilute chlorine gas (2% chlorine/98% nitrogen) over solid sodium chlorite, which yields pure chlorine dioxide gas. An additional benefit of chlorine dioxide gas is that it has a color, which allows it to be measured by a photometric device that analyzes certain wavelengths and measures absorbance. This absorbance can then be used to calculate the concentration (mg/L). This allows the process to be tightly controlled and very repeatable.

The typical chlorine dioxide gas decontamination process for spaces is to humidify the target chamber to 65% RH and hold this for a conditioning time. Once that is complete, chlorine dioxide gas is injected in the charging step to reach the target concentration. The typical concentration for rooms is 1 mg/L and for small chambers, such as isolators, it is 5 mg/L. This concentration then sits in exposure until a dosage of 720 ppm-hours is achieved for normal space decontaminations. For example, 1 mg/L for 2 hours of exposure accumulates a dosage of 720 ppm-hours.

1 mg/L ≈ 360 ppm
360 ppm × 2 hrs = 720 ppm-hours

Dosage is the accumulation of concentration over time and with chlorine dioxide gas it is referred to as ppm-hours. Studies have shown that a dosage of 720 ppm-hours at varying concentrations (0.3, 0.5, 1, 5, 10, and 20 mg/L) demonstrated a 6-log reduction of spores.27 This dosage or contact time, concentration accumulated over time is based on the conditioning step at 65% RH. Humidity helps condition the spore walls and helps the sterilant achieve its effect.28 ,29 In this application, RH or moisture can be an issue, so it was decided to forgo the RH injection or conditioning step. If steam was injected into the piping system at room temperatures (21°C), condensation would form and introduce unwanted moisture into the system. Previous studies have shown that high concentrations or dosages can achieve log reductions with low RH of 30%-40%.30 In this study, it was found that a 3,000 ppm-hour dosage achieved a 6-log reduction of spores. The dosage was calculated from the cycle with a chlorine dioxide gas concentration of 100 mg/L for 5-minute exposure.

1 mg/L ≈ 360 ppm
100 mg/L ≈ 36,000 ppm
(36,000 ppm) × (5 min/60 min/hours) = 3,000 ppm-hours

Using this as a criterion, a minimum target dosage of 3,600 ppm-hours was determined for this application. Before arriving onsite to perform the decontamination, it was critical to identify each and every drop or point-of-service location. If any location is missed, then the decontamination might not be successful and the contamination will continue to linger.

Materials and Methods

The following materials were used for the study:

  • 1 chlorine dioxide gas generator
  • 1 CSI chlorine dioxide cartridge
  • 1 gas cylinder (2% chlorine/98% nitrogen) with CGA 660 valve
  • 2 EMS chlorine dioxide gas sensors on carts
  • 6 rolls ¼-inch polyethylene tubing (green)
  • 2 ATI PortaSens II low-level sensors, 0–5 ppm
  • 2 BSC scrubbers with hoses
  • 2 ladders
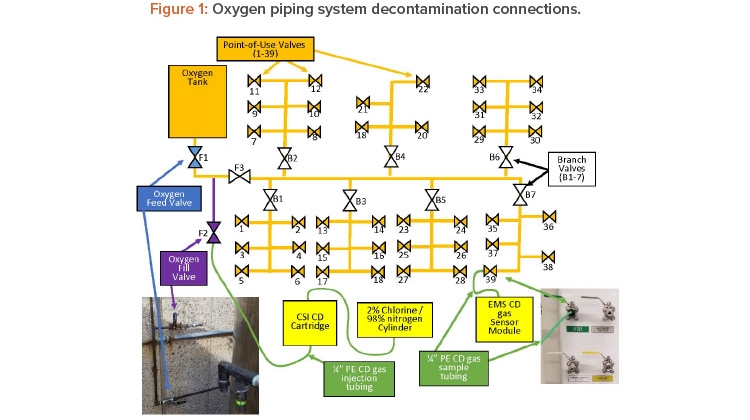
  • Piping distribution system with 39 points of service

The oxygen system is supplied by a 304 stainless steel tank outside the building. The oxygen tank supplies the gas to a 304 stainless steel regulator that reduces the pressure to the operating pressure (50 PSI). This regulator then feeds a copper trunk line, which is made up of 1-inch piping with seven branches that go off to service various stations in the laboratory (see Figure 1).

Each branch has a bronze ball valve (B1–7) to isolate it if necessary repairs/additions are located in a service area. Each point-of-use valve was a 304 stainless steel ball valve located inside the lab. Upon arrival to the site, the first step was to ensure all the point-of-service valves were closed with tubing fittings installed, oxygen feed valve (F1) was closed (to isolate the oxygen tank), and each branch valve was opened. The oxygen tank was not part of the decontamination plan. Once the valve states were verified, the chlorine dioxide gas generator was connected to the system at the oxygen fill valve (F2).

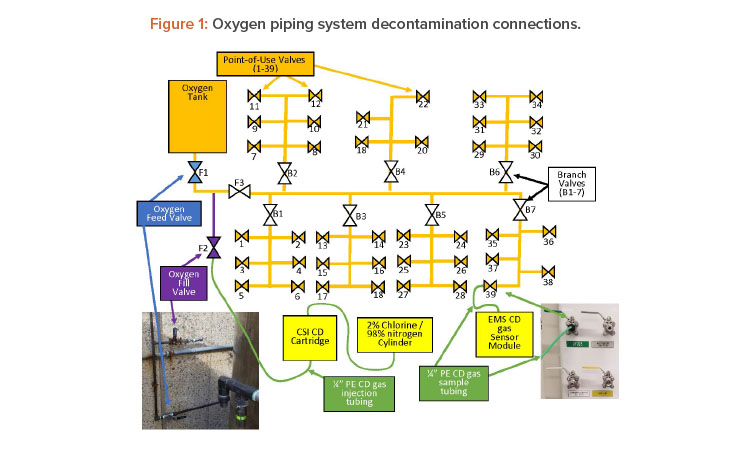
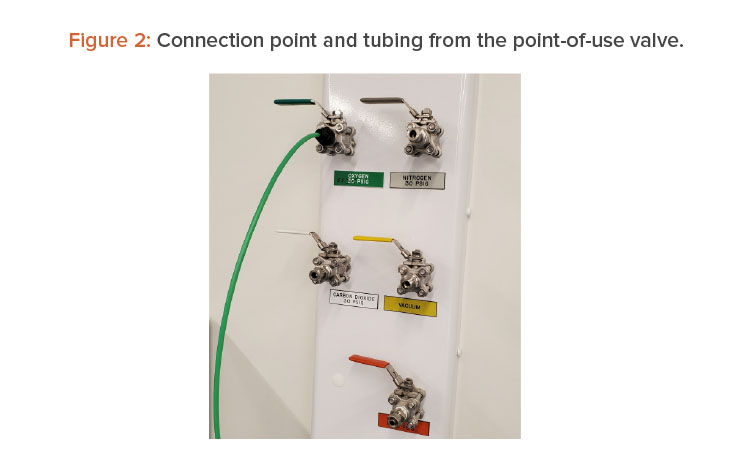
Once chlorine dioxide gas injection connection was made, the oxygen isolation fill valve (F3) was opened to inject CD gas into the trunk. The objective was to fill the trunk with high concentrations of chlorine dioxide gas and then get the gas to each point-of-service valve. To do this, a tube was connected to V39 and bought to the EMS CD gas sensor (see Figures 2 and 3).

After the tube was connected, the valve was opened. V39 is on branch 7 and is the valve the farthest on that branch and farthest from the chlorine dioxide gas injection.

By opening this valve first, the trunk line was filled with high concentrations of chlorine dioxide gas (≈ 100 mg/L). Once the reading at the valve was > 22 mg/L the valve was closed and the next valve was opened (V38). The maximum reading of the chlorine dioxide gas sensor was 22 mg/L, At this point, a second team started the same process by opening (V6), which is the farthest point-of-use valve on branch 1 (B1). Once V6 reached concentration (> 22 mg/L) the valve was closed and V5 was opened. This process was repeated until all point-of-service valves were opened and concentrations measured, and then the vales were closed. After closing the valves, the gas was allowed to sit or expose to achieve the desired kill.

To achieve a target of 3,600 ppm-hours, the exposure time needs to be:
22 mg/L × 360 = 7,920 ppm
(3,600 ppm-hours/7,920 ppm) × 60 min/hour = 27 minutes

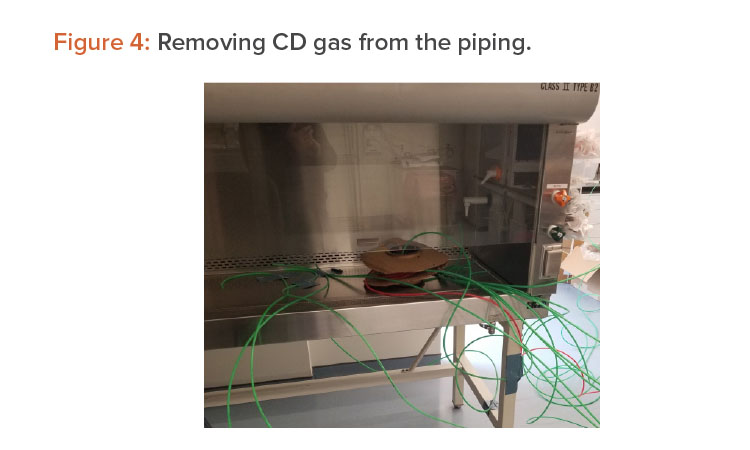
Based on this calculation, the target exposure time was set for 30 minutes. After a minimum of 30 minutes of exposure, the oxygen fill valve/gas injection valve (F2) was closed and the oxygen feed valve (F1) was opened. At this time, the tubing from V39 was brought to an exhaust point and the valve was opened. Figure 4 shows multiple point-of-use tubing running to an exhausting biological safety cabinet to remove the chlorine dioxide gas from the piping. Tubing (green) from each point of use was brought to exhausting biological safety cabinets, fume hoods, exhaust point, or scrubbers—this de-pended on whichever was closest to the point of use valve.

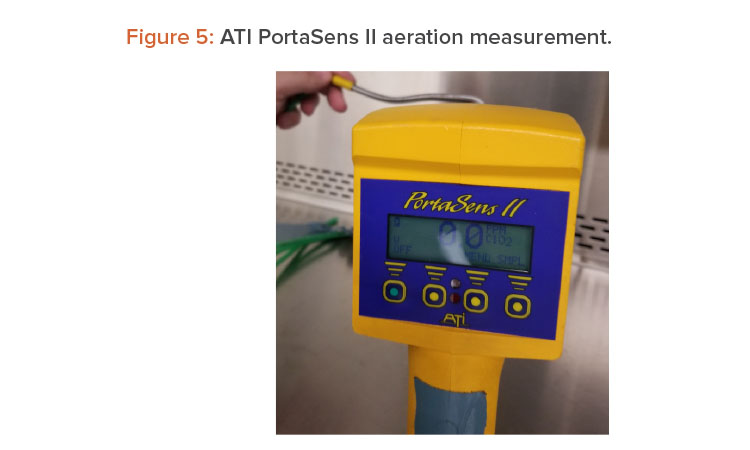
The concentration was then measured using the ATI Porta-Sens II low-level chlorine dioxide sensor at the tubing exit (see Figure 5). Once the con-centration was measured as 0.0 ppm, the line was considered purged and the valve closed and tubing removed, the valve was closed, and the next valve (V38) was opened until the concentrations were at 0.0 ppm.

At this point, the second team brought the tube connected from the point-of-service valve (V6) to an exhaust point, then opened the valve and measured the concentration until the reading was 0.0 ppm. After this the valve was closed and the team moved to the next (V5). This process continued with both teams, until all valves were verified to be completely aerated and measured 0.0 ppm. After this was completed, the chlorine dioxide gas generator and all equipment were removed and packed up, and the facility was exited. The entire process of setup, (connections made; valves opened/closed as needed; chlorine dioxide gas injected, exposed, and gas aerated/removed; and disconnections) took approximately 8 hours.


  • 27Lorcheim, K., and E. Melgaard. “Linearity of the Relationship Between Concentration and Contact Time for Sterilization with Chlorine Dioxide Gas.” American Biological Safety Association 58th Annual Biological Safety Conference, Providence, RI. 9–14 October 2015.
  • 28Agalloco, J., P. Carleton, and J. Frederick. Validation of Pharmaceutical Processes. 3rd ed. New York, NY: Informa Healthcare USA Inc., 2008.
  • 29Westphal, A. J., P. B. Price, T. J. Leighton, and K. E. Wheeler. “Kinetics of Size Changes of Individual Bacillus Thuringiensis Spores in Response to Changes in Relative Humidity.” Proceedings of the National Academy of Sciences of the United States of America 100, no. 6 (March 2003): 3461–6.
  • 30Czarneski, M. “Report for the Decontamination/Sterilization of Charge Point Aseptic Valve.” ClorDiSys Solutions, Inc., Report Number: R-17-0109. 9 January 2017.
Figure 2: Connection point and tubing from the point-of-use valve.

Figure 3: Connection points for EMS sensor.

Figure 4: Removing CD gas from the piping.

Figure 5: ATI PortaSens II aeration measurement.

Results

After the decontamination event was completed, follow-up testing demonstrated the process was successful in eliminating the contamination issue. All swabs taken from several locations showed no growth for any bacillus species. The dosage of each point-of-use valve was calculated by noting the time the concentration was > 22 mg/L and when the concentration was down to 0.0 ppm. This determined the number of minutes that the concentration was exposed at the point-of-use valve. The dosage was calculated using the following equation.

Dosage (ppm-hours) = 360 ppm × 22 mg/L × (number of minutes/60)

The actual minimum dosage in the system was measured/calculated at 6,106 ppm-hours in branch 4. The maximum dosage achieved was 31,723 ppm-hours in branch 1. Branch 1 had the highest dose because this was one of the first sections that chlorine dioxide gas was injected into. Branch 4 was the last section to inject chlorine dioxide gas so it had the lowest overall dosage. No corrosion was noted on any parts immediately after the decontamination or a few weeks later.

Discussion

There was significant variation of dosages within the system. The lowest dosage was 6,106 ppm-hours, whereas the highest dosage was 31,723 ppm-hours. The low dose of 6,106 ppm-hours was much larger than the target dosage of 3,600 ppm-hours. This was easily attributed to lunch (longer than expected). All the gas lines were filled with chlorine dioxide gas and then allowed to sit for minimum of 30 minutes. At this time, lunch was taken and was a little longer than 30 minutes, which accounted for the extra dosage. The large dosage of 31,723 ppm-hours was attributed to it being the line that had the gas in it the longest. This was measured in V6 of branch 1. In this application with the materials used, no corrosion was noted on any parts either immediately or few weeks later after the decontamination. The concentrations in the piping were measured at 22 mg/L.

As noted previously, this was the maximum reading for the EMS chlorine dioxide gas sensor. The actual generation concentration is known to be 100 mg/L, so it can be assumed to be 100 mg/L in the lines. To be conservative, the maximum reading (22 mg/L) was used for all calculations and all assumptions. Additionally, during the purging, several point-of-use valves were opened at the same time. When doing this, the pressure in the system dropped. This necessitated a maximum of four to five point-of-service valves to be opened at any one time to maintain pressure in the system. This was also a contributing factor to the higher dosages in the system. The oxygen supply tank was not part of the decontamination process. It was determined that this was not the source of the contamination, so decontamination of this equipment was deemed not necessary. The oxygen purge to remove the chlorine dioxide gas was the final step of the process.

No follow-up cleanings were done because little to no residues were expected with a dry gas. Studies have shown no detectable residues (chlorine dioxide, chlorite, or chlorate) on potatoes (high organic load) with chlorine dioxide in the gaseous phase.31 Chlorine dioxide gas does not condense on surfaces and is maintained as a gas through the whole process and as such residues are not expected on hard, nonporous surfaces like a piping system. Little organic load was expected in the process for residues to form, as would be expected with potatoes in the reference given previously.

Conclusion

The decontamination service of oxygen piping was successful, as the target dosage of 3,600 ppm-hours was exceeded. More important, it was successful in that there were no follow-up positive swabs for any bacillus strain of organism. The lowest dosage achieved was 6,106 ppm-hours and the maximum dosage achieved was 31,723 ppm-hours. This lowest dosage is 1.7 times the target of 3,600 ppm-hours and 8.5 times greater than the normal dosage to achieve a 6-log reduction (720 ppm-hours). It has been demonstrated that a dry gas can be used to remediate a contaminated piping system.

  • 31Tsai, L. S., C. C. Huxsoll, and G. Robertson. “Prevention of Potato Spoilage During Storage by Chlorine Dioxide.” Journal of Food Science 66, no. 3 (2001): 472–7.

Acknowledgments

The author would like to thank Steven Miller, Daniel Buck, and Paul Lorcheim for their assistance on making this job a success. Without their work, the job would have lasted many more hours.