Pharmaceutical Cleanroom Design & ISO 14644-16
Cleanrooms and controlled contamination environments are increasingly being used across many industrial sectors, including the pharmaceutical industry. An important issue is the operating cost associated with cleanroom energy consumption and, consequently, the identification of applicable energy containment measures. This article reviews pharmaceutical cleanroom calculations for non-unidirectional airflow against energy consumption with known sources of contamination and type of air diffusion used. It proposes alternative cases to compare potential economic savings from applying energy-saving measures proposed by ISO 14644-16.
Pharmaceutical cleanrooms can consume up to 15 times more energy than commercial building systems, with more than 50% of electricity being consumed by plant HVAC cleanroom systems.2 This level of energy consumption is driven by the high air change rates required to ensure the air quality of pharmaceutical production.
Typically, there are two ways to control airborne contamination: a displacement system with unidirectional airflow (UDAF) or a system providing dilution, non-UDAF. Because systems that use UDAF systems have very high airflows, they are not considered here.
When designing a cleanroom with non-UDAF flow, it is important to ensure:
- Environmental contamination is below the limits defined in the user requirement specification (URS).
- The HVAC system is able to control thermal loads to meet temperature and relative humidity environmental requirements.
- The external airflow rate is adequate to maintain space pressurization to compensate for leakage from/to the cleanroom and to account for process air discharge/consumption.
- The airflow rate is sufficient to ensure that the time of cleanroom cleanup is below defined limits. (This requirement is applied to the pharmaceutical cleanroom to ensure compliance with European GMP.)3
The energy efficiency of the cleanroom, including the HVAC system, is subordinate to the reliability and performance of the pharmaceutical process. During the design phase of the cleanroom, the extent of the contaminant source is unknown. To define the airflow rate, designers often rely on industry guidelines. This choice can lead to oversizing the HVAC system, which results in high capital and operating costs.
ISO 14644-16, Part 16, “Energy Efficiency in Cleanrooms and Separative Devices,”1 prescribes a set of recommendations for energy efficiency in cleanrooms and the optimization techniques applicable in every stage of cleanroom life, including airflow rate design.
Energy-Saving Methods
The following methods can be applied to reduce energy consumption in cleanrooms:
- Minimizing cleanroom size.
- Avoiding over specification of the contamination class.
- Installing low-pressure drop HEPA filters.
- Reducing make-up air due to air leakage between two rooms at different pressures, sealing the cleanroom structure (walls, terminal HEPA filters, lamps), and sealing and testing air ducts.
- Minimizing the number of people in the cleanroom. This can be accomplished with technologies that require the presence of a reduced number of operating personnel, such as processes with closed systems, restricted access barrier systems (RABS), and isolators. (A comparison between RABS and isolator technology and relevant operating cost was presented during an Associazione per lo Studio e il Controllo della Contaminazione Ambientale [Italian Association of Contamination Control] conference.)4
- Properly selecting consumables used in cleanrooms and operator clothing.
- Reducing the airflow during the at-rest condition of the cleanroom.
- Avoiding overdesign of airflow rates.
Reference Standards for Air Changes
Many cleanroom regulations and standards do not specify air changes and leave it to the project designer to analyze and define these values, which are important cleanroom design parameters. However, research of regulations and standards documents found a guidance value of 20 air changes per hour (ACH) and a guidance time of 15–20 minutes for cleanup (also called recovery) time. (Table 1 shows the recommended values of air changes across various standards.)3, 5, 6, 7
For Class 100,000/ISO 8 supporting rooms, airflow that is sufficient to achieve at least 20 ACH is typically acceptable. Significantly higher ACH rates are normally needed for Class 10,000/ISO 7, Class 1,000/ISO 6, and Class 100/ISO 5 areas.5
The World Health Organization (WHO) 2019 technical report for nonsterile drugs states, “The number of air changes or air-exchange rates should be sufficient. A guidance value is between 6 and 20 air changes per hour.” It further outlines that manufacturers should establish “how much time it takes for a room that is out of its classification to return within the specified class,” which is often referred to as cleanup or recovery time, and offers a guidance period of 15–20 minutes.7
In the latest revision of the EU GMP,4 the indication on minimum air changes was removed, but the guide retained the requirement of a “cleanup period” of 15–20 minutes.
The ISPE Baseline Guide, Vol. 3, Sterile Product Manufacturing Facilities7 makes explicit reference to the ISPE Good Practice Guide: Heating, Ventilation, and Air Conditioning.8 The latter publication defines the air changes to be applied during the conceptual design phase with the intention to revise and reduce them in the next phase—detail design—when more detailed information about process operation and personnel (number of opera-tors, type of garments worn) will be available.
Airflow in Classified Rooms
ISO 14644-161 dedicates chapter 6 to the calculation of the airflow rate, highlighting that the airflow contributes significantly to the cleanroom’s energy consumption. Therefore, a reduction of airflow rate leads to significant energy savings. In fact, the ventilation power by fans depends on the cube of the airflow rate:
P1P2=(Q1Q2)3
Where P is power in watts and Q is flow rate in m3/s.
The standard introduces the types of air diffusion, the UDAF that removes the airborne contamination by displacement, and the non-unidirectional flow (air mixing, non-UDF) that reduces airborne contamination by dilution. It also describes the method to calculate the airflow for non-UDAF to dilute the airborne contaminants. The equation adopted for the calculation is reported in Annex A:1
Equation 1:Qs=Dε∗C
Where Qs is flow rate (m3/s); D is the rate of emission of particles or microbe-carrying particles (MCPs) from sources of contamination (counts/s); C is the limit of particles/m3 or MCPs/m3 in the environment, and ε is ventilation efficiency.
| Source | Sterile Production | Nonsterile Production |
|---|---|---|
| • USA FDA aseptic guidance 5 |
• 20 ACH | |
| • EU GMP 3 | • Cleanup period 15–20 min | |
| • ISPE Good Practice Guide: Heating, Ventilation, and Air Conditioning 6 |
• 6–20 ACH for CNC (EU Grade D) spaces • 20–40 ACH for Grade 8 (EU Grade C) spaces • 40–60 ACH for Grade 7 (EU Grade B) spaces |
|
| • WHO 7 | • 6–20 ACH |
Due to the uncertainty of the data at the design stage, the standard suggests adopting a compensation factor, expressed in paragraph 6.3.3 as follows:1
a) as a margin for particle concentration limit alert levels, for example, ISO 7 class limit, Cclass, is 352,000 particles/m3 for particles ≥ 0.5 μm, but, for process reasons, its alert level, Clim, can be chosen as 100,000 particles/m3, or even 50,000 particles/m3; and b) as a margin for particle removal effectiveness by lowering the predicted CRE [contamination removal efficiency] or ACE [air change effectiveness] to values less than 1.0 if air distribution is deemed to be not good enough.
Several studies regarding the sources of contaminant emissions were carried out by Ljungqvist and Reinmuller. In an interesting article, Romano and colleagues9 evaluate emissions from personnel, determine the main source of contamination, test different types of clothing worn by operators, and simulate different movements of the operator in a cleanroom. Chapter 5.2 of ISO 14644-16 establishes that “the required cleanroom garment levels should also be specified in the URS since they play a vital role in controlling particulate contamination.” 1
The emission of MCPs from process equipment is usually considered negligible. However, the process equipment supplier should provide data for the emission of nonviable contaminants. If this information is not available, ISO 14644-16 mentions that ISO 14644-1410 describes a method to determine the emission of particles from equipment. (The literature provides measured values of particle emissions from some process equipment.)11
In relation to ventilation efficiency, ISO 14644-16 specifies two types of ventilation efficiency: CRE and ACE. ACE is determined according to AN-SI/ASHRAE 129-1997,12 which relates the nominal time constant to the age of the air at a point:
Equation 2:ACE=TnAi
Where Tn is the nominal time constant, equal to 1/N (room air changes), and Ai is the air age at measuring point, equal to 1/ni (local time changes).
Whyte13 demonstrated that the ACE value can also be calculated as the ratio between the air changes at the measuring point and the nominal air changes in the room. The air changes can be calculated from the particle decay as follows:
Equation 3:n=−1t∗lnCCo
Where t is the time to switch from initial concentration, C0, to final concentration, C.
Then the value of ACE is calculated as:
ACE=Recovery time measured at 1pointRoom air changes
The CRE ventilation efficiency is calculated as follows:
CRE=Airborne pacrticle concentation at exhaustAverage airborne pacrticle concentation in the room
Though the ASHRAE standard defines how to measure and calculate the ACE value, there is no standard for the CRE value.
The CRE coefficient is used when the contamination comes from a precise, fixed source. The CRE index gives information about the ability of the ventilation system to control the contaminants emitted from a specific source but does not provide any information about the efficiency of the cleanroom's ventilation system, and it cannot be used to predict the level of airborne contamination that could be reached in the cleanroom.
Considering that the source of contamination in a cleanroom is not always located at a fixed point (for example, the operators in cleanroom), the suggestion is to use the ACE index to calculate the airflow rate.
ISO 14644-16 Appendix A.2.2 states that, “in the majority of cleanrooms, the main contamination problem is caused by personnel who move freely about the room. In that situation, the aim should be to ensure that sufficient contamination-free air reaches the critical location(s) to ensure the required concentration of contamination.”1
The air diffusion system should be designed to reach an ACE index as close as possible to 1, the perfect mixing. If the value is less than 1, it means that less “clean” air reaches the point of measurement, whereas if the value is greater than 1, it means that more “clean” air reaches that point.
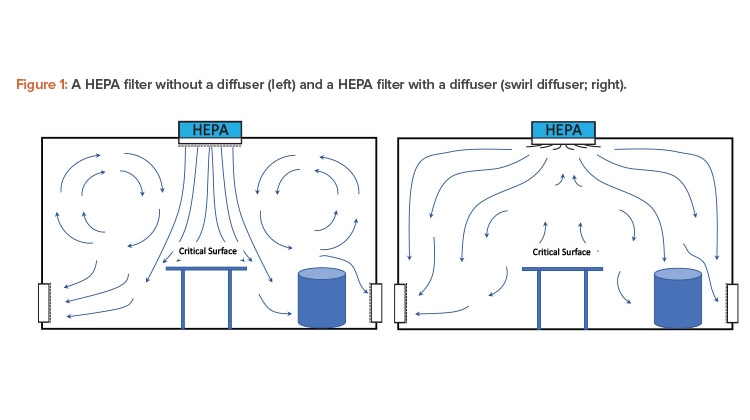
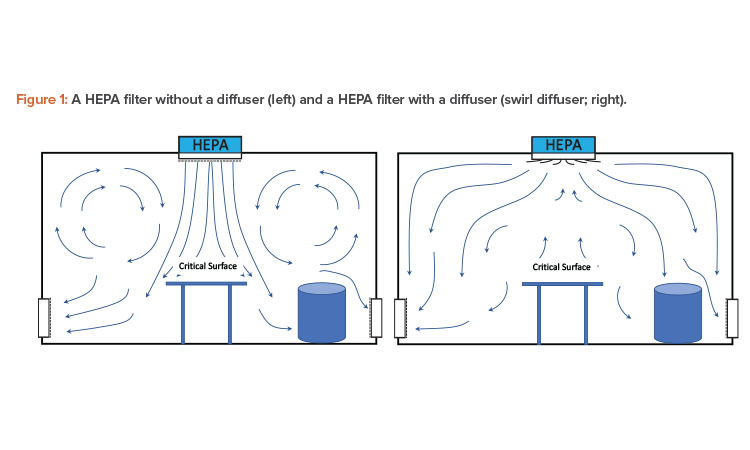
The ACE index depends on the type of air diffuser. Figure 1 shows a HEPA filter with and without a diffuser. (ISO 14644-16 defines a diffuser as a “device placed on inlet air supply terminal to improve distribution of incoming air with room air. A mesh grille or a perforated screen is not considered to be a diffuser.” )1
In a diffusion air system with a HEPA filter without a diffuser, most of the air is supplied directly under the HEPA filter, where the cleanliness level is greater than in the rest of the room. Accordingly, the ACE index under the filter shall be greater than 1, whereas in the rest of the room it will be less than 1. In this situation, the air diffusion shall not be homogenous with consequent nonhomogeneous particle concentration in the cleanroom, and nonhomogeneous room volume temperature. The nonhomogeneous room temperatures may cause discomfort for operators and, more importantly, may lead to uncontrolled air currents in the cleanroom, increasing the risk of product contamination.
If the same degree of cleanliness is required throughout the room—a necessary condition when the emission sources of contaminants are not fixed in space and time—air diffusion with a HEPA filter without a diffuser would not be the most suitable option. Air diffusion with a HEPA filter without a diffuser creates a sort of unidirectional flow, which is required when a higher cleanliness class is necessary to protect a zone locally—for example, the point of the vessel loading in a preparation room.
In summary, in a cleanroom with non-UDAF, the supply airflow is calculated with equation 1, where the ACE index is determined with consideration given to:
- Type of diffuser
- Performance of diffusers that normally create good air mixing in the room but operate at higher or lower speeds than the design
- Generation of uncontrolled air currents due to the supply air being warmer or colder than the cleanroom, and consequent uncontrolled air currents in the cleanroom volume14, 15
- Presence of fixed emission sources (process equipment that emits particles, workplaces where heavy activity by the personnel is required)
- Possible obstructions due to the presence of process machines or various equipment, such as vessels, which limit the air penetration in some areas of the cleanroom with phenomena of short circulations of the air between the supply and the air return
It is also worth considering Eaton’s analysis of cleanroom contamination measurements,16 where, after verifying the contamination class of the room according to ISO 14644-1 (2015 version),17 it was found that the contamination value was above the limit at a point. Following this, the ACE index was verified at each point of the cleanroom, and at the point where the contamination was very high, the ACE index was much lower than 1, meaning there was bad air distribution in proximity of a source of particle emission [16]. In conclusion, it is reasonable for the calculation of the airflow to consider an ACE value of 0.7 when the air is supplied in the cleanroom with high-induction diffusers and is extracted through floor-level return.
Thus far, the airflow rate has been calculated using equation 1, which considers cleanroom contamination sources. But pharmaceutical cleanrooms must also satisfy the “cleanup” period requirement, as indicated in the EU GMP Guide, Annex 1.3 The cleanup period can be calculated using equation 3, integrated with the ACE index, as follows:
Equation 4:n=−1t∗(lnCCo)∗1ACE
Having defined the cleanup period, this equation can also be used to calculate the airflow for an air lock, material, or personnel.
Table 2 presents the results of the airflow calculated with equation 1 (dependent on the source of contamination) and equation 4 (dependent on cleanup period). The airflow due to cleanup period is greater than the airflow due to contamination sources (airflow is expressed as air changes).
| Cleanroom surface (m2) | 100 | ||
| Cleanroom volume (m3) | 300 | ||
| Nonviable 0.5 m |
Viable MPCs | Cleanup Time |
|
| EU GMP Grade C limit (operational): Airborne contamination, cleanup time |
3,520,000 part/m3 |
100 MCP/m3 | 15–20 min |
| Alert limit/m3 (considering a compensation factor of 30% of the limit) |
1,000,000 | 35 | |
| Cleanup period limit | 15 min C = 352,000 C0 = 3,520,000 |
||
| Total particle and MPS dispersion rate per second, due to 10 people (emission rate per person: 15,000 part/s of 0.5μm, and 2MCP/s) |
150,000 | 20 | |
| ACE | 0.7 | 0.7 | 0.7 |
| Calculated air change, ACH | 2.6 | 9.8 | 13.2 |
Note: The higher air change shown in the table (13.2 ACH) is lower than the minimum US FDA–required ACH (20 ACH).5
| HVAC System in Operational Mode |
HVAC System in Attenuation Mode (At Rest) |
|
|---|---|---|
| Airflow reduced percentage | 100% | 50% |
| Supply airflow rate (m3/h) | 10,000 | 5,000 |
| Total HVAC system pressure drop (Pa) | 1,150 | 670 |
| Fan efficiency | 75% | 70% |
| Fan power (kW) | 4.3 | 1.3 |
| At-rest condition total hours/year | 3,900 | 3,900 |
| Total blowing energy (kWh/year) | 16,601 | 5,181 |
| Blowing energy saving (kWh/y) | 11,420 | |
| Electric energy cost (Euro/kWh) | 0.12 | |
| Operating expense saving (Euro/year) | 1,370.4 | |
Cleanroom Energy Costs
It is common for cleanrooms’ HVAC systems to be in continuous, 24/7 operation, even during nonoperational (at-rest condition) hours when a reduction in airflow rates would allow energy savings (unless, of course, the room cleanliness is compromised).
Table 3 shows the estimated annual energy and cost savings of a cleanroom designed to reduce the airflow rate during the at-rest period.
In Chapter 7 of ISO 14644-16, there is a focus on the cleanroom parameter, in particular on the room pressure that “should be maintained to pre-vent ingress of contamination from the surrounding area into the cleanroom or clean zone.”1 This requirement is consistent with the Chapter 53 of the EU GMP Annex 1,3 which states, “A filtered air supply should maintain a positive pressure and an airflow relative to surrounding areas of a lower grade under all operational conditions and should flush the area effectively.” Therefore, the HVAC system and relevant pressure control loop should be designed to avoid any peaks of room pressure out of the limit, positive or negative, even when the cleanroom is transitioning from operating mode to reducing mode, or vice versa.
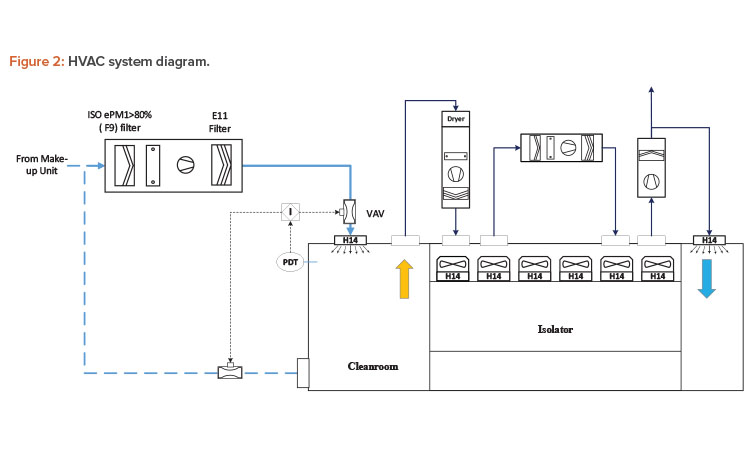
One strategy to reduce the airflow rate could be to smoothly adjust the set-point values of the HVAC system’s variable air volume (VAV) air valves and combine the airflow tracking with the room pressure sensor that, if necessary, adjusts the offset of the airflow track to keep the room pressure differential at the desired level. The supply and return VAV air valves must be selected considering the accuracy of the flow measurement and relative errors.18
Figure 2 presents an example of a cleanroom pressure control for a filling room with isolator; the VAV system has been carefully selected to control the room pressure in all phases of the isolator operation.
Energy-Saving Opportunities
Annex B of ISO 14644-161 lists the energy-saving opportunities, with the different opportunities organized by stage of implementation:
- Source strength evaluation
- URS
- Design, redesign, and construction
- Testing
- Operation and maintenance
- Cleanroom disposal (decommissioning)
Annex C of ISO 14644-161 states that “a careful assessment of the impact and consequences of any proposed energy optimization change should be carefully addressed in the context of the fundamental principles of establish control and then demonstrate control.” It further outlines that assessment factors should include contaminants; people variability and uncertainty (people are a highly variable source strength of contamination; and people density, gowning, and cleaning are significant factors to consider); and process variability. Also reviewed and considered were Annex D, “Benchmarking: Energy Performance Indicators for Cleanrooms,” and Annex E, “Useful Measures to Minimize Excess Heating and Cooling Losses or Gains.”
The following examples and Table 4 illustrate energy savings associated with the saving of make-up air (the annual cost of make-up air of a pharma cleanroom ranges between 1.5–2.0 Euro/[m3/h]) and the saving of energy for cooling and heating of air supply.
- Example 1, saving make-up air, improving the duct air tightness: Designing the ductwork with a good air tightness (class ATC 3 according to EN 16798-3,6 compared to normal air tightness duct (class ATC 4 according to EN 16798-3) may save 2% of make-up air (that is, 1,500 Euro/year operating cost saving for a supply air of 50.000 m3/h).
- Example 2, saving make-up air, shaping the opening of conveyor belt: By reducing the dimension of the opening from original size of 0.2 × 0.2 m to 0.1 × 0.1 m, shaping the opening around the vials, with a differential pressure of 15 Pa, it is possible to reduce four times the airflow through the opening. The airflow across the opening is calculated with the equation: Q(ls)=840∗A(m2)∗√Pa
- Example 3, avoiding the overlap of cooling and heating of supply air: An excess of air cooling of 1°C given by the cooling coil of the recirculating unit means an additional heating of 1°C of the duct reheating coil. For a supply air of 10,000 m3/h, 1°C cooling means 3.4 kWhcooling (corresponding to
- 0.56 kWhelectric; chiller European seasonal energy efficiency ratio = 6) and 1°C heating means 3.4 kWhthermal (corresponding to 0.4 Nm3/h natural gas, heating system efficiency 85%).
- Example 4, using less severe internal thermo-hygrometric conditions: Considering that the internal hygrometric conditions depend on the cooling and dehumidification of the make-up air in summer and steam humidification in the winter, the calculation of the operating cost of the cleanroom with three different internal conditions is referred to the pretreatment of the make-up air.
Conclusion
High operating costs for a cleanroom are mainly due to the HVAC system. Most cleanrooms currently in operation were planned and built following de-sign criteria that were defined some years ago and were consistent with the production and plant technologies available then.
| Cleanroom Indoor Temperature and Relative Humidity* |
Annual Cost (Euros) of 1m3/h of make-up air treatment |
Annual CO2 (kg) per 1m3/h make-up air treatment |
|
|---|---|---|---|
| Case 1 | Summer: 22°C, 50% Winter: 22°C, 40% |
1.62 | 5.06 |
| Case 2 | Summer: 22°Cm, 55% Winter: 22°C, 35% |
1.51 | 4.91 |
| Case 3 | Summer: 22°C, 60% Winter: 22°C, 30% |
1.43 | 4.86 |
| Assumptions: • Costs are based on yearly outdoor condition for mid-Europe region. • 180 g CO2 per kWh due to natural gas consumption. • 352 g CO2 per kWh due to electrical energy consumption. |
|||
*Less-stringent indoor conditions can be applied once it has been verified there is no risk of
discomfort to operators and no impact on production process.
Over the years, significant progress has been made in process technology. The pharma industry is increasingly moving toward single-use equipment, fitting, and tubing; functionally closed process steps that are isolated from the surrounding cleanroom air; and more efficient localized protections (isolation technology) for open processes. Better-performing garments have been developed and significantly reduce the emission of particles and MCPs. Operating procedures have also improved, simplifying the work of operators, increasing use of electronic batch records, implementing paperless documentation, and reducing the shedding of particles.
Consequently, some biopharmaceutical companies have updated their guidelines, reducing the minimum air changes to reflect these advances. With reduced air changes required in cleanrooms, companies can maintain compliant, controlled contamination environments while reducing energy consumption.
About the Author