Technical
November / December 2020

Justifying Investment in Manufacturing Execution Systems

Dirk Sweigart, BSME, BSCS, MBA
Article

Executives at manufacturing companies of all sizes need to make decisions about where to invest to maintain and grow their businesses. Investments in manufacturing execution system (MES) applications may reduce costs and increase revenues, but they also might compete with other investment priorities, such as marketing campaigns and capital equipment upgrades. This article offers guidance for life sciences companies considering investment in manufacturing execution system applications, including how to measure MES-related cash flow and reasonably evaluate an investment in manufacturing execution system versus other alternatives.

Manufacturers considering investment in an manufacturing execution system may wish to consult the GAMP® Good Practice Guide: Manufacturing Execution Systems, 1 which provides an overview of issues to evaluate in a strategic assessment of MES options:

  • The current status of the business pertaining to manufacturing system requirements
  • The desired state of system requirements to be achieved, including a breakdown of high-level functionality required to advance the business while managing costs
  • Analysis of desired functionality already in existing systems, and any needs for new systems to be added to the domain (automation, MES application, enterprise resource planning, quality control, data historian, etc.)

Operational Justification

Output from the strategic assessment provides a roadmap and justification for MES application functionality. Sometimes, the need for MES applications is so overwhelming that this evaluation simply provides the scope of implementation. If it is not possible to operate a process without MES functions, the entire business case for manufacturing the product is based on having MES applications in place.

For existing production facilities, the operational justification for the MES is typically based on quality and patient safety needs, such as nonconformances, corrective and preventive actions (CAPAs), customer complaints, and inspection/audit observations, as well as business needs, such as expansion plans, anticipated process/product changes, and overall business agility to meet as-yet-unknown demands.

For new operations, using an approach such as failure modes and effects analysis (FMEA) can identify risks that can be mitigated by implementing MES applications, such as the following:

  • Data collection risks: The data collection rate or volume is too high for reliable manual recording.
  • Raw material risks: The number of materials, the use of similar materials, or criticality of material additions introduces the chance that incorrect materials could be added or materials could be added in the wrong order.
  • Sample tracking risks: The number of samples or complexity of sample management introduces high potential for sample misplacement or mislabeling.
  • Manual operations risks: The complexity of manual operations increases the likelihood of operator error.
  • Compliance risks: Other required documentation cannot be accurately and consistently completed by a human without additional human review or observation due to the complexity or quantity of the documentation.

Financial Justification

Even when an MES can be justified solely on the basis of quality, identifying additional financial justifications strengthens the business case and can garner additional support from the investment decision-makers. To financially justify a project, one must show that the company will profit by making this investment for current products or the investment will be necessary for future development.

A common metric used to evaluate or compare alternatives is return on investment (ROI). If there is only one alternative being considered, the evaluation is versus the current state, often referred to as the “base case.” The base case is what would happen if the investment were not made. Two common methods of calculating ROI are internal rate of return (IRR) and net present value (NPV). These calculations are very similar, so we will focus on NPV.

In addition to IRR or NPV, investments are sometimes evaluated based on a payback period (how long it takes for the investment to pay for itself). Using a payback period can sometimes be misleading because it only looks at how long it takes to “break even.” Two options may have the same payback period, but one alternative may continue to provide benefits for a much longer time than the other. It is also possible that one solution would require much greater future investment (maintenance). Both of these are differentiating factors that are reflected in the NPV.2

NPV Comparisons

To calculate NPV, look at all incremental costs and incremental benefits over the life of the system.2 These are defined as cash flows—costs that must be spent to define, build, deploy, and maintain the MES (outflows), and real quantifiable benefits derived by having and using the MES (inflows). These are incremental because it is the difference between the proposed option and the base case, or between alternatives, that is important. For example, assume that the current system needs a server upgrade to continue functioning. In this situation, buying a new server for the MES is not an incremental cost because the new server is required regardless.

These costs and benefits (incremental cash inflows and outflows) occur over time. For example, the major cost of the MES occurs up front, whereas the cost savings occur over the following months and years. To make a fair comparison, costs or benefits that occur in later months or years are “discounted” to the present using a standard interest rate (often referred to as the “risk-free rate”). As an example, a quality improvement project that results in a rework cost reduction two years from now is not as valuable as having that reduction right now. The future reduction is discounted (to the present) so that it can be compared with all other costs and benefits, all discounted to the present (the NPV). This can be represented as:

NPV formula

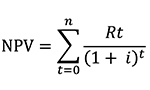
In this equation, Rt is the sum of all incremental cash flows (in or out) in a period, t is time (typically measured in months, but can be years or days), and i is the discount rate (the return that could be had in a risk-free investment, such as a certificate of deposit) for that period. The discount rate is often set by the company finance department.

The NPV calculation is available in Microsoft Excel as “=NPV (rate, list of values).”

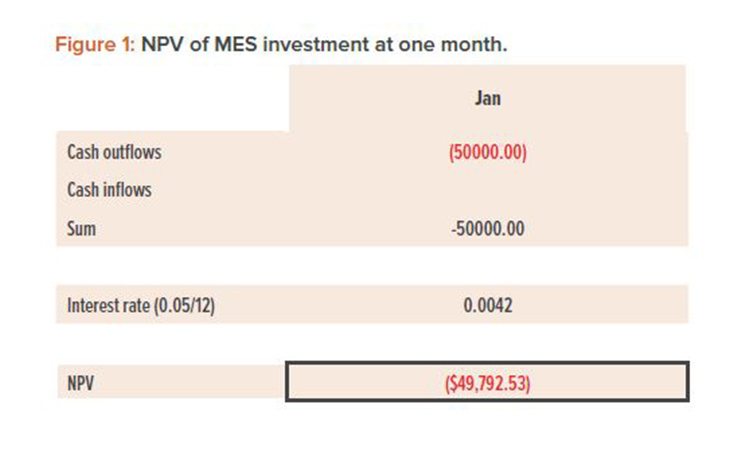
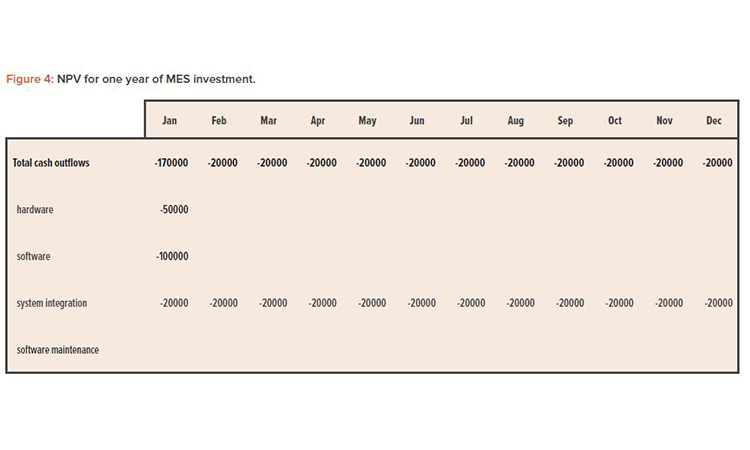
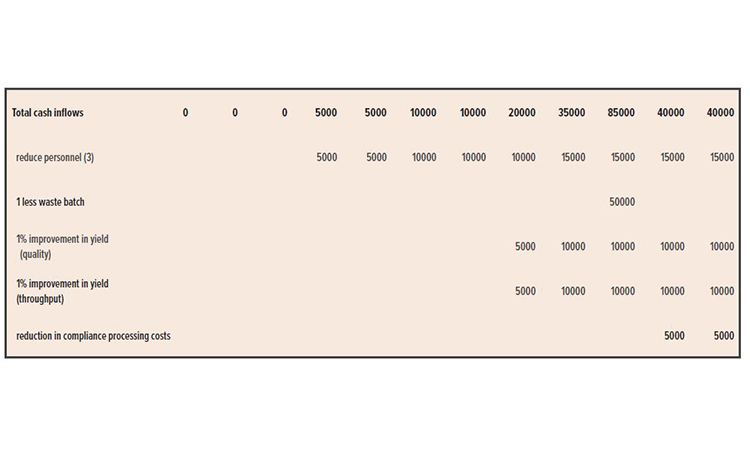
As a simple example, let’s say that in December (now), you are trying to decide whether to invest $50,000 in new MES applications. The entire investment can be made in January. Then, each month after that, the system reduces scrap by $5,000. We will look at one year. The finance department says they could invest that money at a risk-free annual rate of return of 5%. No other incremental cash flows have been identified.

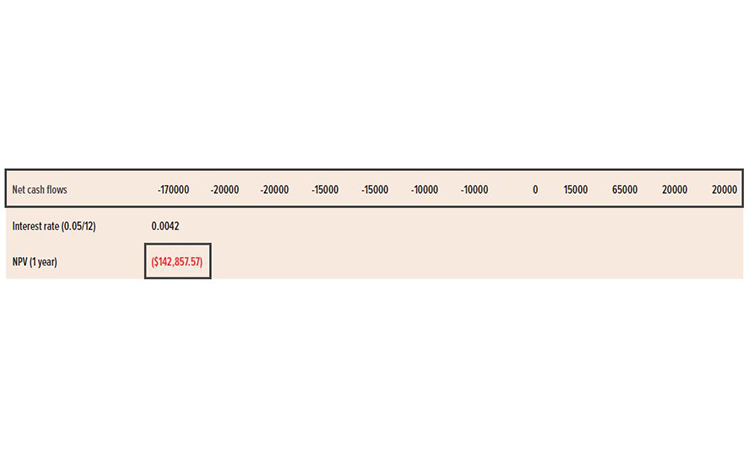
The cash outflow in January will be $50,000. But that has to be discounted by the risk-free rate (0.42% per month). The NPV calculation using just the January cost is negative, as would be expected (Figure 1). On this basis, you would not do this project (negative NPV). Note that the $50,000 spent in January is equivalent to $49,790 spent now (that is, if you invested the $49,790 now at an annual rate of return of 5%, compounded monthly, you would have $50,000 in January).

To calculate net present value (NPV), look at all incremental costs and incremental benefits over the life of the system.


  • 1International Society for Pharmaceutical Engineering. GAMP® Good Practice Guide: Manufacturing Execution Systems – A Strategic and Management Approach. North Bethesda, MD: International Society for Pharmaceutical Engineering, 2010.
  • 2 a b Hopkinson, M. Net Present Value and Risk Modelling for Projects. Advances in Project Management series. New York, NY: Routledge, 2016.
Figure 1: NPV of MES investment at one month.

Figure 2: NPV of MES investment at two months.

In February, there is an expected positive inflow of $5,000 (reduced waste) and no outflows (Figure 2). However, on this basis, you would still not do this project because the NPV is negative (but less negative than in January).

For the first year, the NPV is $3,634 (Figure 3). This positive NPV indicates that the project would add value to the company. However, it may have a lower NPV than another project.


Figure 3: NPV of MES investment for year 1

A proper NPV analysis should span multiple years and forecast both future investments needed and future benefits that would be gained. Additional-ly, the NPV for a specific investment should always be compared to the current state or another alternative (which would also have future costs or future benefits).

Incremental Cash Flows

Incremental cash outflows are often relatively easy to collect, but one must be careful to examine each outflow to see if it is truly incremental. For example, the costs for a systems integrator are likely incremental because you would not have those costs if you did not do the project. However, assume you have an internal team that is currently supporting an application that will be retired and they will be implementing this new MES. The cost of that team is not a “new” (incremental) cost because it would be incurred if the current system stayed in place or if a new system were put in place. In contrast, if additional people were hired (or assigned to this project from elsewhere) for the duration of the project, the cost of the additional staff would be an incremental cost as long as they worked on the project.

If you are comparing this alternative to the current state, be careful to not only consider the current year for the current state. Existing systems (and processes) often require ongoing investment, such as support contracts, network capacity increases, hardware maintenance, and/or planned upgrades. Software maintenance is an example of an ongoing current-state cost. Training operators (such as new operators) on the existing process might be an example of ongoing non-software costs. If operators need to be routinely trained on something, no matter what system, then there is no incremental cost for the alternative relative to the base case.

Generally, hardware, software, and implementation costs can be relatively easy to quantify within a range. However, be careful when considering the time that people who are already employed would spend on the alternative: this is unlikely to truly be an incremental cost if they would be employed anyway.

A proper NPV analysis should span multiple years and forecast both future investments needed and future benefits that would be gained.

The real skill needed for financial justification is to collect and quantify the benefits of the project to the company in terms of changes to future cash flows. Benefits can be classified in two categories: cost reductions and revenue increases. Some benefits may belong in both categories. For example, a 1% quality improvement could reduce the amount of waste for disposal (a cost reduction), increase the process throughput (less time needed to create a complete process order, also a cost reduction), and be a basis for a modest product price increase (revenue increase). It could also result in fewer product returns (another revenue increase or cost decrease). Each of these needs to be considered and estimated over time. Table 1 summarizes some common sources of cost reductions (reducing cash outflows).

Personnel reductions are often a sensitive topic, but they are a reality in this age of automation. Human resources costs need to be looked at closely and confirmed to be real. For example, suppose automating batch records frees up one hour a day for each of eight people (one labor-day). That may be the basis for a head count reduction. But if the head count is not actually reduced, the personnel costs of running the plant do not change (although there may be benefits realized by reallocating workers’ time to other products or processes). Also, if one position is eliminated from the batch records staff but an additional (higher salaried) person is hired to support MES implementation, the difference between the salaries is actually a cash outflow.


Table 1: Examples of cost reductions associated with MES.
Category Areas of Opportunity Cost Estimate Methodology
Labor needs MES will reduce human resources needs in several ways, such as:
  • Eliminating a second check (e.g., for weighing or dispensing)
  • Eliminating manual data entry, data transposition
  • Reducing management and storage of paper documentation and paper master batch records
  • Reducing time to review batch records (MES performs the checks)
  • Eliminating the need to rework nonconforming materials
Estimate cost savings based on current processes (valuestream mapping is one technique).
Materials conformance

Using an MES will reduce the number of nonconforming batches, thereby reducing
material, labor, and disposal costs.


Improving materials conformance also reduces product variability and improves the
safety profile, avoiding recalls.

Review nonconformances, evaluate which ones would be
eliminated if MES applications were in place, and estimate
the associated costs.
Some nonconformance examples are:
  • Using expired or quarantined materials
  • Missing data
  • Adding wrong materials, wrong amounts, or in the wrong order
  • Continuing to process material with excursions
Production capacity Using an MES can increase production capacity by helping:
  • Eliminate nonconforming product
  • Improve cycle times
  • Improve yields

If a unit operation is at or near full capacity, increasing throughput will directly affect revenue but also may require investment in additional capital or overtime shifts to expand capacity.

Evaluate cost savings and investments associated with MES related increases in production capacity.
Waste disposal Using an MES can reduce waste arising out of production of nonconforming materials. Calculate the cost of disposing of excess waste from nonconformances or low yield.
Resource efficiencies

As the MES improves efficiency, increases yield, or reduces nonconforming materials, the per-unit labor required will also be reduced.


An improvement in yield is both a cost reduction and a production improvement.

Estimate labor cost reductions to be realized by reducing
staff , eliminating overtime, and/or role consolidation.

Making less waste has many benefits that can be quantified (if the reduction can be truly attributed to the MES). These may include lowering waste disposal costs and the cost of the raw materials consumed. A less-wasteful system may also realize savings in machine time, human resources, and power consumption. These cash outflows decrease because a greater amount of saleable product is made in the same time.

If certain sources of waste can be eliminated altogether, some processes may no longer be needed at all. For example, manual sorting through boxes to repack “good” product versus “bad” product could be eliminated.

Executives typically divide these benefits into “hard” (quantifiable) and “soft” (difficult to quantify and hard to obtain) categories. Soft benefits are often considered to be not as good a basis for an investment as hard benefits. Whenever possible, hard benefits should be identified. It is possible that only the hard benefits will be used to evaluate this investment and that each one will be closely examined by the financial officers.


Table 2: Potential MES-related revenue improvements.
Improvement Type Comments
Greater asset productivity If the MES allows more saleable product to be made in the same time on the same equipment, the margin of that incremental product should be considered a cash inflow.
New sales or better support for sales growth For a plant in a sold-out position, every additional unit that can be produced is a cash inflow of the margin of that unit.
Customer retention due to improved cost and quality Getting new customers can be a lot harder than retaining current customers. However, if it can be shown that MES implementation retains a customer that would likely be lost given the current state, the retention can be considered an incremental cash inflow.
New product support A flexible MES may reduce or eliminate costs that would be incurred if new products require changes to existing systems.
Faster decisions Uncertainly about the disposition of a product can cause it to sit in a warehouse or delay shipment. Quicker resolution of such issues saves money and could lead to faster realization of revenue.
Better decisions If the MES can provide data that ensure good product is not wasted and bad product is not manufactured or distributed, these data offer quantified examples of real revenue increases or cost savings. Also, the MES may support improvements
in factory scheduling, maintenance work (particularly preventive maintenance), and staffing.
Better (and more accessible) data Better data alone will not improve revenue and reduce costs. However, good, accessible data help companies respond to customer queries like “When will my order be done?” High-quality data are also useful to trace a quality problem to
a raw material. Reducing the time needed to address these types of issues can mean fewer customer service personnel are required.
Reductions in working capital Keeping material around when it is not immediately needed for production or sale is wasteful. These materials take up space and money. Eliminating them frees up working capital—money, space, or e ort that would be spent dealing with
these items can instead be used elsewhere. However, be careful when including these factors in cash-flow calculations: these are “one time” cash-flow changes.
Better compliance profile and inspection results Fewer nonconformances and manual errors reduce the risk of regulatory scrutiny and subsequent regulatory actions. The monetary value of these improvements may be di cult to quantify; however, in certain cases, avoiding costs and increasing yield in this area could be large enough to justify MES on this basis alone.

When evaluating cash flows, be sure to consider all revenue improvements that can be identified. Table 2 identifies many potential types of revenue improvement that may be associated with MES implementation.

Ongoing Investments

In addition to the initial investment in purchasing, configuring, and deploying MES applications, ongoing costs associated with the MES need to be considered. From an IT perspective, MES operation will involve application and system support and maintenance, ongoing user training, periodic upgrades and enhancements, and user management.

Considering a Range of Outcomes

The future is uncertain, and projects often don’t turn out as planned. Costs may be more than expected, or unforeseen glitches can arise. There may even be unforeseen benefits!

To compensate for this uncertainty, it is often wise to calculate three different NPVs: a best case, worst case, and expected case. For each cost and benefit, ask “What is the worst that could happen?” and “What is the best that could happen?” This author has often found that what is presented as the expected case is actually the best case (if everything goes perfectly, this is what we can achieve).

If these three cases (worst, expected, best) all have a positive NPV, the project should be done. If only the best and expected cases are positive, you know what (risk) factors are key to making the project a success.

Case Example

A pharmaceutical packaging operation is in a sold-out position and running 24/7. Management has the following concerns with the current state:

  • They are having trouble creating the documentation needed for compliance, which is currently done manually on paper worksheets. They have concerns that if they were audited, they would not pass.
  • They are not meeting their production goals. They believe they should have a higher output, but they do not know what to do to improve it. With the 24/7 operation, they have struggled to identify the problems impacting production after hours.
  • They are concerned about their future CAPA costs and believe they need to minimize those risks.

The company is considering whether to invest in a pilot MES application on one line to address these issues. The operations team is recommending systems that would greatly automate data collection, collect data on the process orders (including getting the causes of any lost production from the operators), and provide a real-time view of the progress of process orders through the packaging lines.

To make the business case for the MES, each of these items has to be realistically quantified in terms of their impacts on the company’s cash flow. For example, what is the real potential for a compliance audit and what are the real consequences if the company does not pass it? The possibilities range from $0 (no audit or no issues) to the entire value of production for a time period (if production must be halted and orders are lost).

The projected costs for the MES are as follows:

  • Hardware: $50,000 for a server and new workstations (in addition to existing hardware)
  • Software: $100,000 for licenses, plus a 15% annual budget increase for maintenance
  • Services: $240,000 to implement the software over one year ($20,000 per month)

Figure 4: NPV for one year of MES investment.
Figure 4: NPV for one year of MES investment.(cont.)

Figure 4 shows a one-year NPV analysis. Note that the NPV is a large negative amount, as would typically be expected in the first year. For the purposes of this example, the benefits begin to be realized midyear, and the cash flow turns positive in September.

Figure 5 shows that a three-year analysis looks much better and has a positive NPV. Note that the payback period for this project occurs in the second quarter of year 2. The positive cash flow, however, could go on for years.

Conclusion

The decision to invest in MES applications should be driven by sound economics, based on real costs and benefits. The costs and benefits considered should be incremental, representing changes from what would happen anyway (the current state or base case) or, in the case of alternatives, real cash-flow differences between the options. Using NPV analysis over an appropriate time frame and considering the range of outcomes possible can help drive more rigorous, real, defendable, and profitable decisions. Creating best, expected, and worst cases can clarify the risks and should ensure that investments pay off if even the worst case has a positive NPV.

Figure 5: NPV for three years of MES investment.
Figure 5: NPV for three years of MES investment. (cont.)