Features
November / December 2020

Cell & Gene Therapy Facility Design Using Simulations

Niranjan S. Kulkarni, PhD
Cell & Gene Therapy Facility Design Using Simulations

Designing new facilities for cell and gene therapy manufacturing is a challenging task given the many uncertainties in this industry sector, including varying potential demand for any given new therapy, evolving platforms and technology, questions about equipment reliability, learning curves for analysts and operators, possible sourcing issues, and variable lead times for key raw materials. All these factors influence facility sizing, equipment quantities, required head count, and the flow of people and materials. One approach to managing these uncertainties at the facility design stage is to develop operational models and perform computer simulations. The information generated via these simulations enables management to make data-driven decisions.

The number of cell and gene therapy treatments in development has increased exponentially in recent years. While cell therapy had a larger market segment than gene therapy in 2018, gene therapy products are likely to replace or outpace several cell therapy products and account for more than 50% of market share by 2024.1 The global gene therapy market size in 2019 was estimated at USD 1.2 billion. It is projected to register a compound annual growth rate of 16.6% from 2020 to 2027. 2 These therapies are mainly driven by the potential exhibited by chimeric antigen receptor (CAR) T cell usage and have gained significant attention from commercial and noncommercial sponsors.

These therapies are produced in a range of settings, from laboratory-scale to full-scale facilities, with most processes involving highly manual operations. As these therapies move toward commercialization and volume demands increase, current practices and technologies will need to be modified. New facilities will also be needed to implement larger-volume manufacturing.

Operational Modeling and Simulations

Computer modeling and simulations from an operational perspective improve general understanding of the manufacturing process and support the development of optimal facility designs. The field of computer modeling and simulations is broad and can include discrete event simulations (DESs), process modeling, computational fluid dynamics, building information modeling, augmented reality and virtual reality, and other approaches. This article focuses on the use of discrete event simulation only. A list of commercially available computer modeling and simulations tools is provided in reference.3

Figure 1 shows the overall methodology for a discrete event modeling and simulation study. The first step is to define precise modeling objectives and identify both the metrics supporting these objectives and potential scenarios to be analyzed. Though this step may seem trivial, it is very important and can influence the study duration and budget.

Figure 1: Typical modeling and simulation study methodology

For a facility design effort, the primary objective is usually to “right-size” the facility to help satisfy patient demand in the most cost-effective manner. Right-sizing involves estimating equipment, personnel, utilities, site logistics (material/personnel movement), and spaces for production, raw material, intermediate and finished goods staging, and support functions (e.g., warehousing, quality assurance [QA] and quality control [QC], maintenance, and administration). These operations and functional areas influence and are influenced by the facility footprint.

For facility design problems, simulations should ideally be performed at the concept or even the feasibility stage to determine whether the right type and size of facility is being considered. Companies looking to modify existing facilities also need this information to make the right decisions when evaluating their options.

After the objectives and metrics are established, relevant supporting data must be gathered to develop a baseline model. As with any simulation, the model will only be as good as the data inputs used to build it (garbage in = garbage out). Because most cell and gene therapies remain in clinical stages and are yet to be produced at commercial scales, data collection efforts will rely on inputs from subject matter experts and laboratory research data. Assumptions must be established. To characterize the uncertainties involved, it is highly recommended to use a range of values instead of using average values or point estimates. Whenever possible, actual data should be used and fit to statistical distributions to capture the variability influencing operations.

Models developed using the discrete event simulation technique, a special case of Monte Carlo simulations and the time-advance mechanism, are best suited to capture these variabilities and uncertainties because they can randomly select input data from a predefined statistical distribution, run multiple replications, and perform “what-if” analyses. Since the inputs are probabilistic, the outputs will also be stochastic in nature. This allows end-users to make decisions based on their appetite for handling risk.

Recent advancements in computing power and graphics have improved visualization capabilities of these models. Figure 2 shows a screenshot of a discrete event simulation model. Appropriate animation and visualization help in model verification and improve communication and stakeholder buy-in. The 3D animations can help designers better visualize traffic within key corridors, any congestion points, adequacy of intermediate staging spaces, appropriate adjacencies needed, and other factors.

DES models help characterize uncertainty and variability inherent to the operations, while helping visually communicate the results.

The baseline model results must be verified and/or validated to ensure the model is behaving as intended. At this step, assumptions may be fine-tuned, or additional data may be required to more accurately mimic the process that is being modeled.

After completing the verification/validation phase, the model can be used to perform scenario analysis to determine how changing different variables affects the modeled metrics. Sensitivity analysis can also be performed to identify variables or assumptions that influence the design metrics.

These verified/validated models can serve as excellent tools for identifying bottlenecks and key areas of concern. This information can then be used to develop risk mitigation plans to help manage the uncertainties associated with the design and construction of facilities in an emerging field.

Case Study

The study objective was to design a facility to satisfy a desired throughput rate while achieving an optimal cost of goods (COGs). To meet the desired demands, it was important to estimate equipment and direct (and indirect) labor needs for manufacturing, QC, and support functions. Additionally, logistic plans and warehousing and storage needs had to be established. As mentioned earlier, all these attributes influence facility sizing. Although raw materials and labor are the highest contributors to the COGs, followed by equipment, the study focused only on labor and equipment because in most cell and gene therapy production, the facility must scale out rather than scale up.

Output of the sensitivity analysis to establish the number of platforms per suite.

Table 1: Total gowning time per employee versus capacity per area.
Capacity
(no. of people in the space)
 Performance Metrics
(minutes) 
Locker Room Grade D Grade C Average
Lead Time
Maximum
Lead Time
8 10 10 17.1 20.7
9 5 9 16.6 19.3
10 5 9 16.3 18.4
10 5 8 16.5 18.8
10 4 8 16.5 18.8
10 4 7 16.9 20.2

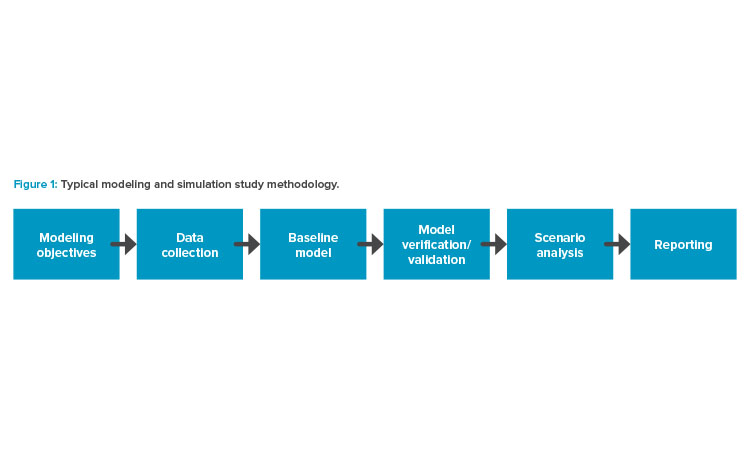
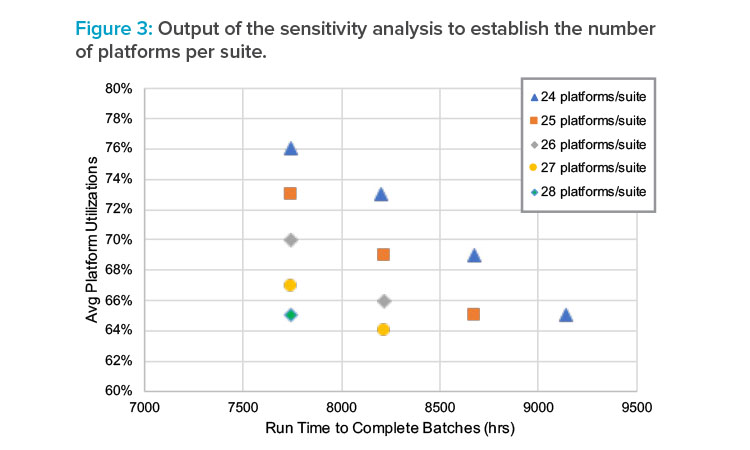
To make the most-effective facility decisions, key workflows and relevant data were collected for manufacturing operations, QC, and supply chain requirements. Assumptions were carefully documented, and a baseline model was developed using these inputs and assumptions. The model was used to make key decisions regarding the number of suites as well as the number of platforms (sets of specialized pieces of equipment and technology) to be installed per manufacturing suite. The platform is considered critical in the value stream based on the cycle time and the equipment cost. Given that the technology is new and not fully vetted, expecting higher production utilizations would also be unrealistic. Time had to be allotted for training and other (unforeseen) events.

Sensitivity analysis was performed to identify the best combination of acceptable utilization, batch cadence, and quantities of equipment needed to meet the target demands within the given time frame. Figure 3 shows the graphical output of this analysis. The sensitivity analysis revealed that the annual demands cannot be satisfied if the run time exceeds approximately 8,500 hours.

The model was also used to simulate several scenarios, such as simulations to:

  • Level load work and understand the extent of cross training required to avoid additional head count
  • Assess waste handling strategies
  • Justify certain automation in QC to reduce turnaround time, head count, and equipment needs

While the study looked at optimizing equipment and head count, key space types (e.g., gowning areas) were also right-sized. Though gowning is essential, time spent in gowning should be considered as essential non-value-added time, and reducing this time is recommended.4  However, adding more gowning space and maintaining it can be cost prohibitive. Thus, it is important to strike the right balance between gowning time and the investment and operating expenses for maintaining large gowning spaces. Table 1 shows the results from the simulation analysis that aimed at reducing the overall lead time for operators (i.e., the time spent per operator to change from street clothes to gowning requirements to enter Grade C space) as a function of room occupancy.

Conclusion

Operational simulations are a powerful tool to help estimate the resources required to influence space needs and facility size. Though it is important to study the main production systems, the study should also include support functions, such as QA/QC and warehousing. In addition to equipment, headcount, and space needs, these models can also help right-size intermediate staging spaces, develop waste handling strategies, ensure adequacy of utilities, and so on. Operational simulation studies should be undertaken at the early stages of design.

Because models can only be as robust as the data used to construct them, excellent communication with subject matter experts and accurate documentation of inputs/assumptions are critical components of operational simulation. The right questions must be asked to ensure that the right data are obtained and that the model will address the users’ needs. It is essential to translate and communicate the underlying algorithms in a manner that can be understood by the people providing the data on which the model will be based. Communicating the results generated by a simulation in a manner that the stakeholders and end users understand is equally important.

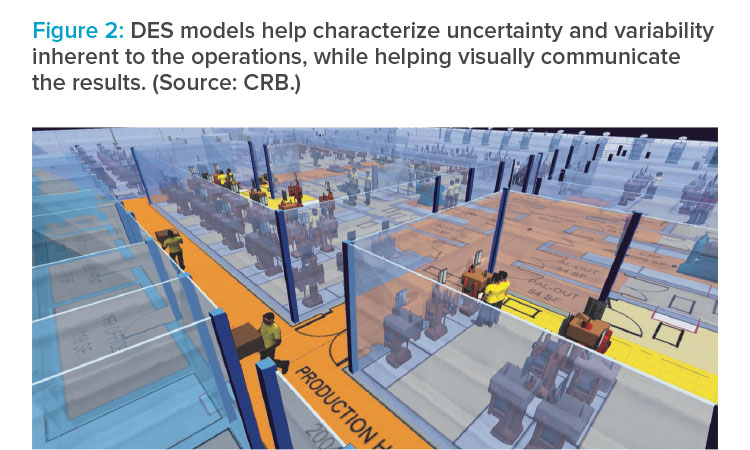
As mentioned earlier, operational models built using the DES technique help characterize the impact of variability and uncertainty. However, running multiple replications is the key to success with these models. Each replication selects unique values from the statistical distribution, allowing the model to capture the entire range. Selecting the correct number of replications is also important to avoid increasing the overall model run time.

Like quality documents, simulation models should be considered as living documents. These models can also be viewed as digital twins of an actual facility. Before making one or more significant changes to a facility or an operation within it, simulations can be run to determine the impact of the changes and develop strategies to overcome any adverse situations.

Once any change is made to a facility design, it is important to modify the model to reflect that change (i.e., create a new baseline). The simulation can then be rerun to confirm that the desired result was obtained. Updating the model is also essential so that it continues to reflect the current state of the facility. Whenever additional actual data that can inform the model are obtained, the data should be added to the model. This ensures that the model’s performance and prediction accuracy improve. For instance, once the facility has been constructed and is in operation, actual data on the process cycle time for a particular step can be fitted to a probabilistic distribution and used to rerun the analysis.

  • 4Benson, R., and N. Kulkarni. “Understanding Operational Waste from a Lean Biopharmaceutical Perspective.” Pharmaceutical Engineering 31, no. 5 (2011): 74–82.

Acknowledgment

Sincere thanks to all the reviewers who helped enhance the content of this article.