The process validation life cycle is defined as the collection and evaluation of data from the process design stage throughout production that establishes scientific evidence that a process is capable of consistently delivering quality products. It is a regulatory expectation that manufacturers understand their products and processes, regardless of whether products are manufactured internally or at contract manufacturers. This includes periodic review and monitoring to ensure a state of control—see guidance from the US FDA, WHO, and European GMPs, as well as the International Council for Harmonisation of Technical Requirements for Pharmaceuticals for Human Use (ICH) Q8 R2, ICH Q10, and Pharmaceutical Inspection Co-operation Scheme (PIC/S) Annex 15., , , , ,
The application of CPV/OPV has become a core regulatory requirement and goes beyond traditional annual process reviews (APRs) and product quality reviews (PQRs): CPV programs also monitor critical in-process parameters and material attributes throughout the product life cycle and are typically performed on a more frequent basis. The concepts described in this article should be considered distinct from continuous process verification, which is an alternative approach to traditional process validation in which manufacturing process performance is continuously monitored and evaluated. This science- and risk-based real-time approach typically involves inline, online, or at-line controls and monitoring of process performance and product quality on each batch.
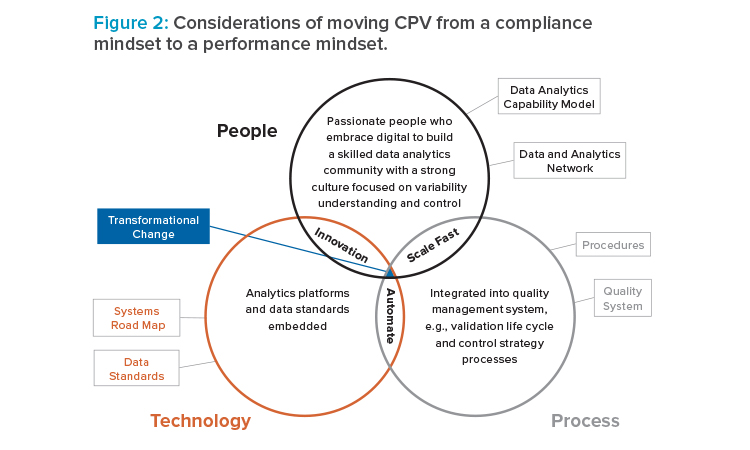
However, the combination of Pharma 4.0™ concepts—which enable organizations involved in the product life cycle to leverage the full potential of digitalization to provide faster innovations for patient benefit—and the application of performance-based control strategies may mean these concepts will be one and the same.
Survey of Current Industry CPV Practices
Even though a CPV process has been required by EU GMP regulation since 2015, full implementation is still far from a reality. Completing data gathering, analysis, and reporting at higher frequency than the annual APR/PQR demands resources, which is just one of the many possible reasons for industry's lagging adoption of CPV. To further analyze the factors affecting CPV adoption, we designed and distributed a survey for pharmaceutical companies from countries in the ISPE Iberia Affiliate (Spain and Portugal) to evaluate the level of CPV implementation in those countries.
The survey was completed anonymously by 28 companies. Among them, 75% had 250 or more employees. Although it is not a large overall number, the variety of profiles including innovator, generic, biologics, CMO, medical device, and API, is significant and therefore the results can be considered representative.
The frequency of reviewing data and issuing CPV reports can be controversial. Some companies still do this annually, integrating this review into the PQR. This is increasingly being questioned in inspections and audits, however, because a retrospective study is not the objective of the CPV; rather, the CPV’s goal is to complete a prospective study with the aim of detecting trends and early signs of loss of process control to take preventive actions for these risks. The study found that 46% of companies may not have yet implemented real (non-annual reporting) CPV when considering frequency.
Data acquisition, from both the process and the controls carried out over the process, often consumes many resources, especially when the information is recorded in a paper or hard-copy format and comes from different sources. The time and staff necessary to gather the data decreases with digitalization (electronic records) and with the integration of the various sources of information into repositories. This allows the export of data to the corresponding analysis and reporting tools—a much more agile way that still preserves data integrity.
Digital data management facilitates obtaining information from the process in real time, which is the spirit and ultimate goal of the CPV. The survey revealed that 46% of responding companies have a medium to advanced level of digital data management with integrated electronic data solutions. A follow-up question about the time necessary to gather the data for CPV per product found that 18% would require less than an hour for this task. This is one of the indicators presented by the most advanced companies in digitization. Other respondents would require four hours or more to gather data for CPV. It is also noteworthy that 82% of companies include critical quality attributes (CQAs), critical process parameters (CPPs), and critical material attributes (CMAs) as variables for CPV monitoring and only 18% measure CQAs alone.
Statistical analysis follows data collection. This can be approached with a classic statistical process control with control charts and capability analysis to verify that the process is stable and capable. In some cases, control chart alerts may indicate a risk to product quality that should be addressed. Other data analysis tools can help identify a problem’s root cause. In pharma, multivariate statistics and other advanced analytical tools are beginning to be used due to their effectiveness in analyzing increasingly large and complex data packages. Most companies use spreadsheets or standard statistical packages, but a significant 11% use advanced analytics.
In relation to the personnel who complete these tasks, 71% of responding companies claim to have personnel trained in statistics or data scientists. Regarding the use of the CPV outcomes, companies were asked: Does your company use the CPV information in any way other than GMP compliance? In response, 32% said no and 68% responded yes. Of that 68%, answers on how CPV information was used fell into the following categories:
- Control of variability and process improvement
- Early detection of trends and changes
- Correlations and troubleshooting
- Use as key performance indicators
- Comparisons between different sites and business decision-making
Finally, we asked if the companies had cost estimates for digitizing or automating the ongoing verification process. Twenty-five percent of the companies had performed this exercise and predicted a period of two to five years for implementation and a cost between €300,000 and €1 million.
CPV Maturity Score
By assigning scores to each survey response, we obtained a classification based on the degree of maturity in CPV practice, meaning in the degree of process monitoring and maintenance of the control state. Approximately 20% of responding companies likely are not complying with current GMP requirements; 50% are complying but do not use the full outcomes of the information provided; and nearly 30% have the appropriate systems to use the full potential of the information to improve both the quality and efficiency of their manufacturing plants.
These findings demonstrate how the technological factor (digitization and systems integration) makes a difference by drastically reducing the need to allocate resources (staff and time) to data collection and the subsequent analysis and reporting. These tasks can be automated, which would allow time and staff to be shifted to more valuable activities, such as improvement and decision-making tasks, based on the available information.
Value Beyond GMP Compliance
The benefits of implementing an automated CPV (or CPV 4.0) extend well beyond compliance. Adequate and timely process monitoring ensures robust processes through early detection of drifts in performance before they result in deviations. In our experience, these deviations not only require time and resources to investigate, but can also sometimes lead to batch failures, supply chain problems, and increased production costs.
Robust processes enable pharmaceutical manufacturers to meet supply chain requirements, including introducing new sources of active pharmaceutical ingredients (APIs) or raw materials and transfers to new sites. Further, CPV monitoring enables and enhances cross-site and cross-product learning. To achieve these advantages, a gradual implementation is recommended.
CPV Personnel
Two groups of personnel are involved in completing CPV. The names of these groups may vary across organizations, so here they are referred to as CPV data analysts and manufacturing staff. Data analysts create the CPV report and implement changes from the improvement actions. Technical service, engineering, and quality assurance staff are some examples of CPV data analysts.
Manufacturing staff are the personnel directly involved in the goods treatment process: operators and their supervisors, operations quality, and maintenance. The manufacturing staff benefit from the knowledge acquired from the CPV report for improvement opportunities that is used to create corrective and preventive actions (CAPAs). The knowledge acquired during the product commercial life is considered valuable for the development staff, both as feedback for continuous improvement and as knowledge to be applied to new products.
Completing CPV
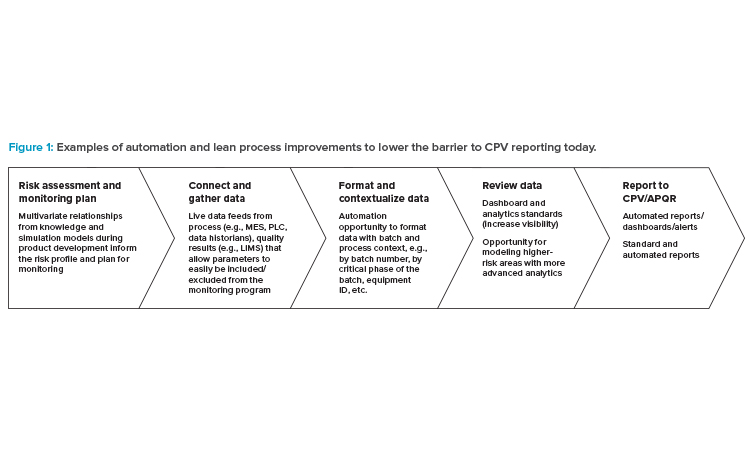
Data Collection
The first step is for CPV data analysts to gather the data. Before a full CPV program is deployed, data may come in different formats: from centralized systems with powerful spreadsheet reports, .txt/.csv/.pdf reports with numerical data that each system
creates, manual data taken from batch reports, or even text data from investigations, reports, and other written documentation that must be manually read to extract relevant data.
When a fully automated CPV process is implemented, all data will be gathered automatically in real time. The system will read from all data sources. It could even be a real-time reading of data sources, and the CPV could also take information from human-written reports such as investigations, although these features may be implemented in later stages of the CPV. Even though the technology to gather data automatically is well established in the market, its implementation may still be one of the biggest challenges because it may require a lot of resources (i.e., money, time, and work). This high resource consumption also means that being too ambitious may drive the project to fail. Implementation phases will be covered later in this article.
Data Formatting and Contextualization
The second step is for CPV data analysts to format and contextualize the data so only relevant data is used in the report and it has the correct format for the software that analysts use to be able to process the data (this is usually referred to as data cleansing). As mentioned, data will come from disparate sources, in different formats, and with different contextualization. Data may be structured in well-formatted tables, but also in plain text with missing metadata (data that gives meaning to the numbers), in pictures, or written by people. When the automated CPV is fully installed, the data-gathering process will also automatically perform the data cleansing process previously mentioned. As a result, the CPV data analysts will have a single and well-structured data repository.
Data Analysis
Once all data are clean, CPV data analysts will use statistical and advanced analytical tools to pull information from the data. This information will, at first, be used for compliance needs such as verifying the process capability and the state of control. In later stages of automated CPV, the data will give deeper insights and increase understanding of the process. And, of course, a fully implemented CPV will generate the report automatically.
Automated VS. Manual CPV
So far, the biggest value yet achieved is changing from a manual to an automatic process. The most obvious benefits of automated CPV are gaining resources such as time and staffing and lowering the risk of manual entry error. These also drive higher data integrity levels. But the real benefit is found beyond automating these tasks. If CPV data analysts do not have to spend time gathering data, cleaning data, and writing reports, they can focus on creating better and more comprehensive insights in a continuous manner. Through statistical analysis (either classical or through machine learning and artificial intelligence), it will be possible to determine the influence of each process parameter (either critical, CPP, or not) over each CQA. Reports could also be configured so that the CPV would indicate the future behavior of the process (predictive information).
CPV would provide a better process understanding. Further, it would allow earlier detection of critical-to-quality events, leading to a more efficient root-cause investigation and issue resolution. Root causes can be derived from complex multivariable models, which are able to define the most influential input variables for the event. In one of the last stages of the CPV, the system would even be able to indicate what actions should be taken (prescriptive information). It would be possible for CPV data analysts to create a new set of CPPs based on what is actually influencing quality, or to update the already existing set.
Future models to be included in fully automated CPV will be able to predict a deviation on a CQA based on how each process indicator affects the process. This is possible because statistical algorithms may discover hidden influences, from process events to the process outcome. This way, the process knowledge that the CPV data analysts obtain from the predictive models will enhance the knowledge from classic process engineering sources based on deterministic models (physical, chemical, and/or thermodynamic laws based). There is even more to come. Once advanced CPVs are implemented together with process analytical technologies, then continuous process verification (validation on real-time basis) and even real-time release testing can be considered.
Benefits of Automated CPV
The first benefit is having quality information about the process performance. Using this information, it is possible to create new indicators in the process, as well as discover the importance of others that may already exist but are unrecognized. These process indicators will not only tell if a variable or CQA has moved out of limits (simple information), but also how big the risk is to product quality during a whole process (complex information). It will also be possible to have all the information on a real-time basis due to automation.
An automated CPV will inform earlier about critical events using predictive algorithms. For manufacturing staff, this means that both expected and unexpected events can be handled in advance. Moving from preventive maintenance to predictive maintenance has many benefits. First, changing from a schedule-
based machine stop to an accurate prefailure machine schedule means fewer stop times throughout the year, which allows more machine availability and, in turn, higher production capability. Next, knowing if a machine or a process is about to fail reduces the number of unexpected stops that could drive to a quality issue and, thus, to a product loss.
Predicting events is not the only advantage. As information may become available faster, quality decisions can also be made faster. Some alarms may be created to prompt because of complex indicators that measure changes over many variables, which will allow more processes to move to approval by exception, lowering the workload of quality departments, reducing human error, and reducing production lead time. This will allow the process to be continuously validated on a real-time basis.
Having complete information about the process and equipment will help process engineers modify the plant to create more efficient and robust processes. This, in turn, will lead to using fewer resources such as fewer intake materials, less energy, and less time. CPV not only increases production capabilities, speed, and quality, but it also reduces the cost of the finished goods.
![Figure 3: The CPV 4.0 road map with colors aligned to Gartner’s Types of Analytics Capabilities (2017) terminology [9].](/sites/default/files/pe/2022/0522_PE_MJ_FeatureTebar_04.jpg)