Two Real-World Experiences in Global Sustainability
The article appraises the real-world experiences of two pharmaceutical companies approaching the rollout of energy- and water-reduction programs to selected facilities around the world. It is the result of more than two years of collaboration between the company corporate teams, individual site teams, and an external specialist consultant.
Company A is a leading research-led pharmaceutical company that operates globally and is in the top 10 pharma companies in terms of sales revenue. It has a mix of operations, such as vaccine production, other biotechnology processes, solid oral product manufacturing (tablets and capsules), and research facilities. The company has sites around the globe, with a large footprint in North America.
Company B is a top-20 global manufacturer of consumer products (mainly over-the-counter medicines and some prescription medicines). They also contract manufacture products for other companies. Many of the brands are well known. Their processes are solid and liquid oral dose, with a limited amount of sterile product manufacturing.
Company A
This company has had a long-standing commitment to sustainable operations, which is supported at the highest level in the organization. However, because of other priorities, they had made limited progress on reaching targets for energy use and water reduction. That started to change in 2016 and 2017, when they made structural changes and set aside a capital budget specifically targeted at supporting manufacturing sites with implementation of energy-, water-, and waste-reduction projects. Access to this fund was contingent on completing a standardized-methodology energy and water assessment using a specialist external consulting firm with expertise in the sector. This supported overall objectives of targeting capital spending to have the biggest impact and proceeding in a coordinated way.
The initial program was sponsored by the corporate operational finance team, who were championing cost reductions within the supply chain. The stakeholders recognized that cost and carbon (energy) reductions are synergistic, which meant the program could support a number of strategic objectives, including cost of goods, sustainability targets, operational excellence, and personnel engagement/talent retention.
In the first phase of this assessment, 11 sites were assessed (audited) for both energy- and water-saving opportunities over a two-year period (2017–2018). The sites ranged from small packaging/distribution operations to large multiproduct manufacturing campuses.
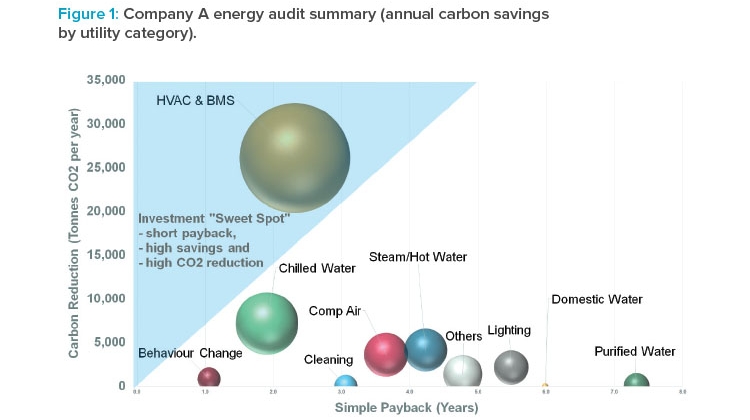
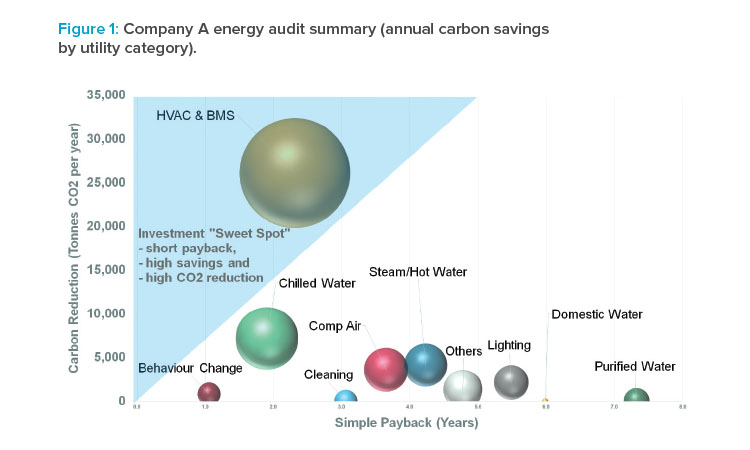
Figure 1 summarizes the findings from these energy and water assessments. Over 270 specific project opportunities were profiled for cost and carbon savings, capital implementation cost, and risk/benefit analysis. In addition, savings for more than 140 low- or no-cost ideas were not quantified, as these initiatives could to be pursued with very little effort.
In Figure 1, the bubble size represents the relative estimated cost reduction for each utility category. The total savings identified exceeded $6 million per year, equivalent to 25% of the annual utility costs for all sites. Notably, at the time of the audits, all sites were already well maintained and operated, with great technical team knowledge and expertise; therefore, this high level of opportunity was not a result of neglect or lack of knowledge. Instead, it was the result of taking a specific, focused approach and challenging the accepted practices through the lens of sustainability.
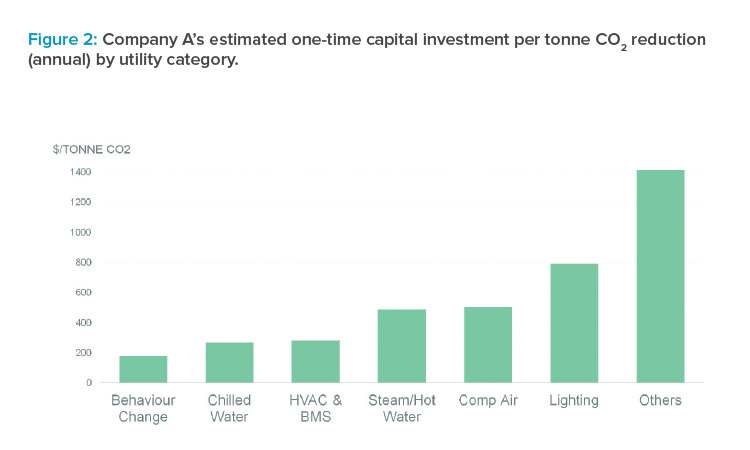
It was no surprise to find that HVAC and associated building management system (BMS) controls presented the most attractive investment opportunity. This category was by far the greatest energy-saving opportunity—around 50% of total savings identified. See Figure 2 for data on Company A’s investments relative to the carbon savings for various initiatives.
Interestingly, although behavioral change actions were a relatively small contributor to energy savings, they were found to offer the highest return on investment (ROI). These are small, low-cost operational management/staff awareness actions that individually contribute a very small benefit but have a sizeable result when scaled across an organization. Examples would be turning off packaging conveyors when the line is down, shutting down computers at night and on weekends, and switching off unneeded lighting.
Raising awareness simply by communicating the scale, cost, and impact of a site’s energy footprint can have a positive impact on staff behavior, but only if sustainability messaging is supported by consistent leadership policies and actions. Leaders have to walk the talk! A positive employee response to sustainability initiatives can also impact many other utility categories by reducing the “friction” and inertia of making improvements in other areas—if a majority cohort supports the objectives and understands their impact and benefits, that can make investment approvals and project implementation somewhat easier.
Chilled water generation and distribution systems were the second-largest category of energy-saving opportunity. Simple changes such as raising the chilled water setpoint (either continuously or based on seasonal variation) can be easy to make and provide good savings with little or no cost. There were also good opportunities for pump motor efficiency upgrades and introduction of a variable flow system. In many cases, chilled water systems had been expanded and evolved over time, but little consideration had been given to the cumulative impact of these changes on efficiencies; hence, system optimization, rationalization, and chiller sequencing offered common opportunities for system improvements. Finally, cooling tower web bulb control of fans, fan staging, and variable speed drives were all found to be viable options for saving energy.
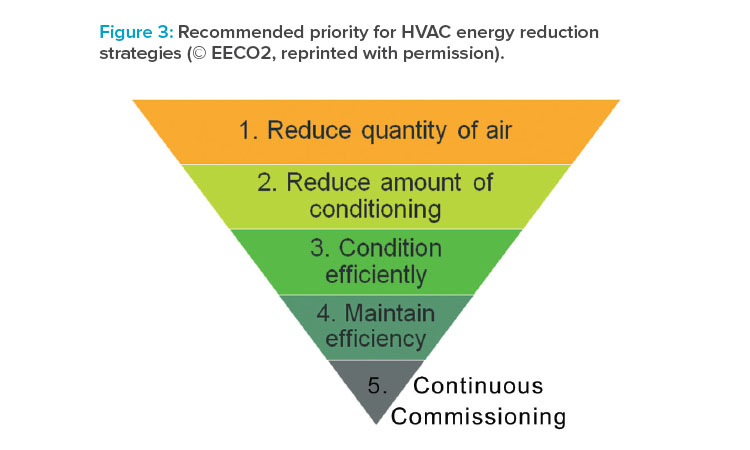
HVAC is by far the largest single utility consumer on most pharmaceutical manufacturing and research and development (R&D) sites. The energy required to move, filter, heat, cool, dehumidify, and, in some cases, humidify the air is responsible for between 45% and 70% of a site’s total energy demand. We can often assume that this energy expenditure is inevitable in the pharma industry because cleanroom environments are needed for manufacturing, and it is true that cleanrooms and laboratories require more energy than an office space. However, the question is: Do they need quite as much energy as they did 5 or 10 years ago, given our improved understanding of cleanroom performance and the availability of much more efficient technologies at lower cost? Indeed, as unit energy costs increase, efficiency investments in HVAC can demonstrate a greater ROI. Figure 3 illustrates the recommended priorities of energy-reduction initiatives for HVAC to achieve the maximum savings and ROI.
When we looked more closely into the types of savings available in HVAC, we found that approximately 60% of the savings opportunities were in GMP spaces (cleanrooms—controlled not classified [CNC], Grade D, and some in Grade C). Grade B cleanrooms were evaluated for savings but were not included in the project proposal because of their relatively low contribution to energy expenditure and challenges in managing and qualifying changes in these spaces. Viable energy-saving opportunities for Grade B cleanrooms were found, but it is always better to focus first on the more easily delivered controlled not classified and Grade D spaces.
More surprising than the ROI on cleanroom efficiencies was the scale of the opportunities available in non-GMP spaces (offices, laboratories, ware-housing), which accounted for 40% of the energy savings for HVAC utilities. This included projects such as time-scheduling systems in offices, supply air temperature reset (a big opportunity at US sites), and demand-based ventilation in warehouses. These types of changes are relatively easy to implement and require small investments relative to the savings available.
Why are many organizations overlooking these easy wins? One of the reasons is resourcing. A site’s technical resources and expertise focus primarily on supporting the manufacturing and GMP spaces. Therefore, companies have limited capacity to look at improvements in noncritical areas. Notably, when organizations have adopted an integrated facilities management model for outsourcing asset maintenance, typically for non-GMP or non–business critical assets, they do not achieve improvements in energy efficiency. This finding is likely a result of contract arrangements (and would be an interesting topic for another article).
Key Themes
Although there were many different project opportunities at each audited site, some key themes were common across most of the 11 sites.
Metering, Monitoring, and Targeting
There was almost a complete absence of submetering of utilities at most sites, and those sites that had some submetering were not actively using the data to inform decisions. Having the right level of information is helpful to target interventions in the right area and to measure the impact of these interventions to validate the business case.
Company A recognizes that investment in this area is needed to help them reach their overall goals.
Meaningful Key Performance Metrics
It is typical to compare this year’s metrics on energy and water consumption performance to metrics from the same periods last year. Although this comparison is of some interest, it does not help when actively managing energy consumption with a goal of improving efficiency. In the pharmaceutical industry, with HVAC being such a key energy consumer, the impact of outside conditions can dramatically affect energy consumption from year to year. For example, it is hard to make conclusions about energy efficiency when simply comparing HVAC energy-use metrics from a particularly hot summer and a more temperate one.
There are techniques that can eliminate (or substantially reduce) the influence of variables such as weather conditions to compare like-for-like consumption. These techniques can also be used to derive meaningful performance metrics that help an organization determine progress and where resources need to be employed for best effect.
The recently published ISO 14644-16 standard for energy efficiency in cleanrooms provides examples of performance indicators specifically for cleanrooms,1 and there are many other publicly available resources giving guidance on energy metrics for other contexts. The key point is the metrics should be specific to the individual site, the buildings, and even the process level if that is relevant.
Sharing with and Learning from Others
At the time of the audits, many sites already had good practices in some areas of their utility system. It was recommended that these practices be shared more widely within the business so that personnel at all sites can learn and improve. Company A had forums for sharing knowledge; however, these were criticized for being at too high a level to be practically beneficial. Sharing of experiences between sites and with other similar companies can be a good way to continually improve and to challenge and try new ideas.
Results in Practice
An energy audit is a tool to prioritize and focus investment decisions. It does not in itself reduce energy consumption. However, when done well, it can promote different ways of thinking and acting within the site team. The best audits also incorporate some element of training such that the site teams obtain tools to look at sustainability opportunities with a different perspective and challenge out-of-date thinking and ineffective approaches to problem-solving.
Results are what really matter: Can you put into practice the audit recommendations, and do they broadly achieve the expected results? It is critical to get this right. Success follows success, so having a good first few projects, well delivered, that meet stakeholder expectations is a key component of a successful program.
For example, Company A planned the execution of a pilot project at one site. They chose to implement several HVAC control improvements in four areas of the site that included offices, warehousing/distribution, and technical spaces. The objectives were to optimize the controls of heating and cooling, introduce demand-based control, and eliminate other inefficiencies in the systems while maintaining a comfortable environment for occupants. The actions taken included:
- Introducing a time schedule to switch off HVAC during unoccupied times
- Recommissioning a strategy to reset the supply air temperature controls to allow the discharge air temperature to increase when there is no cooling demand
- Introducing a deadband to room temperature setpoints
- Installing CO2 sensors through the open-plan offices to reduce the airflow when occupancy levels are low or temperature and CO2 standards are satisfied
- Reducing airflow volume flow rates
On completion of the improvements, the initiatives were evaluated to confirm the results and measure energy consumption. The pilot project con-firmed annual savings of over $190,000, and the project implementation costs were around $100,000. A six-month simple payback exceeded the expected ROI, and the occupants noticed no difference to their environment or comfort.
Company B
Company B wanted to take a more targeted approach to identifying energy- and carbon-reduction opportunities. They opted to focus the audits only on HVAC and associated BMS controls to maximize the efficiency of this utility. The company’s initial objective was to reduce operating costs; however, as they have simultaneously been developing their sustainability strategy, they are shifting priorities to reducing carbon emissions. This change in priorities affects the strategies they can employ.
Initially, two sites were selected for piloting the focused HVAC/BMS energy audit, one in the Europe and one in the US; these sites were chosen primarily because of their high energy spending. The European site opted to focus narrowly on opportunities that would pay back their investment within one year. This need for a quick ROI presented a challenge and limited the range of project opportunities that could be proposed. Following the success of the pilot audits, five more sites were assessed in 2019.
One of the excellent cost-saving opportunities at a US site was combined heat and power (CHP), also referred to as cogeneration. In fact, there was also a possible viable opportunity for combined heat, power, and absorption chillers (trigeneration). This was due to the low relative cost of natural gas (compared with electricity).
However, this proposed project may work against Company B’s new carbon-reduction objectives for the following reasons.
- Combined heat and power would offset the higher carbon factor of purchased electricity with the lower carbon factor of onsite-generated electricity.
- Part of Company B’s future strategy may be to purchase 100% renewable electricity, with a carbon factor close to zero. That would negate the carbon benefit of combined heat and power—in fact, it makes the situation worse because the company would need to burn more gas to run the combined heat and power. There is likely still a cost-benefit from combined heat and power, but the carbon benefit will disappear.
- Even without purchasing “green” electricity, many electricity grid systems are reducing their carbon intensity by increasing the mix of renewable generation. In a few years’ time, many regions of the world will have grid electricity carbon factors much lower than they are today, which puts into question the long-term carbon benefit of combined heat and power.
Therefore, we can see the subtle conflict between a cost-led strategy and a carbon-led strategy. However, what is clear is that simple, effective energy-efficiency improvements (reducing demand) work in all circumstances and are a key component of an effective sustainability strategy.
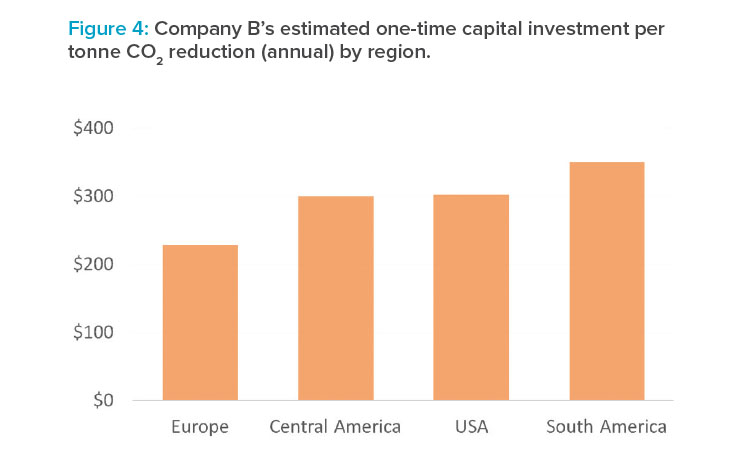
Figure 4 shows regional variation in the investment required to abate 1 tonne of CO2 emissions. The relatively high cost in South America is attributed to the lower carbon content of grid electricity in this region (due to extensive use of renewables, specifically wind and hydroelectricity, in the generation mix). Therefore, an investment of similar value to investments in other regions would be expected to reduce energy consumption by an equivalent amount; however, the carbon content of that energy in South America is much lower. The difference between Europe and the US can be attributed to the relatively higher cost of project implementation in the US in this example.
Results in Practice
Because the focus of the first European site assessed was to identify rapid payback opportunities, the assessment team was limited to opportunities associated with control optimization and demand-based ventilation. The team identified a very good opportunity to convert a large 100% fresh air system to recirculation. Within six months, the first site assessed delivered €120,000 ($130,000) of annual savings by implementing only some of the identified projects. This reduced annual CO2 emissions by approximately 400 tonnes.
The strategies employed included:
- Air change rate reduction
- Demand-based ventilation based on occupancy and temperature demand
- Converting 100% fresh air systems to recirculation
- Switch-off and setback (turndown) during unoccupied periods
- Return air humidity control
The total estimated annual savings from all projects with the potential to pay back investment in less than one year was €180,000 ($200,000). The site continues to implement the remaining opportunities and has not yet assessed their results.
Compared to the European site, the US pilot site consumed much more energy, in excess of 70 GWh per year, of which approximately 60% was attributed to HVAC consumption. The US site had an ongoing asset renewal program that identified integration of sustainability opportunities to enhance the business case. Challenging current standards and design approaches led to a range of additional options with total savings of almost $500,000 per year, with a simple payback of 2.5 years.
Conclusion
These two real-world examples demonstrate that effective management of resources (electricity, fuel, and water) can have a major, positive impact on sustainability and operational cost efficiencies. It is simply good business sense to make efficient use of all resources. It is no longer acceptable for any organization to continue to operate in a wasteful way. The public and market expectations are that major corporations lead by example and set high standards, with investors now taking account of a company’s ability to mitigate the impact of climate change.
Companies A and B are reaping the rewards of their investments in the form of tangible economic and strategic benefits. Many other pharmaceutical companies are also taking positive steps in the right direction. But the pace of change in this area is much slower than the accelerating demands for increased sustainability performance. The solutions that Companies A and B are employing are not “magic”—they are based on sound engineering practice and data, are well proven, and lead to predictable outcomes.
Finally, undertaking an energy or water audit/assessment and implementing a selection of easy initiatives does not mean you have “done” sustainability. Sustainable development should be considered a journey of continuous improvement, with a goal to integrate sustainability thinking and practice into business as usual. This is a fast-changing field: Technologies are becoming cheaper and better; energy and water costs are rising, and company business models changing. The cumulative effect of these forces can dramatically change the economics of efficiency projects from one year to the next. The best performers know this and employ the plan-do-check-act cycle in their energy- and water-efficiency audits on a three-year rotation.
About the Author


