Air Change Rate Reduction during Operation: Success at Roche/Genentech
To improve the energy efficiency of cleanrooms, the Roche Global Engineering and Oceanside facilities and Engineering team collaborated to implement a risk-based approach to achieve lower air changes during operation without adversely impacting the facility, equipment, or reliability, while meeting environmental requirements.
For almost 20 years, it has been known that the original cleanroom ventilation rates from the last century are much higher than necessary to achieve the cleanliness standards set by regulatory agencies. For example, ISO 8 required 20 to 30 air changes in 2001 when Federal Standard 209E was withdrawn. Now most guidance for ISO 8 suggests 10 to 20 air changes per hour (ACH). As such, many of our facilities’ engineering groups started to conduct surveys to benchmark ventilation energy use, with the goal to improve the energy efficiency of HVAC systems by reducing air change rates (ACRs).
The Roche Global Engineering team developed an Air Change Rate Reductions Best Practices Guide in 20191 to guide these pharmaceutical manufacturing site surveys and to challenge and optimize existing installations that use high ventilation rates with the intent of maintaining particulate levels required for manufacturing environmental quality.
At the time, ISO 14644-162 was not yet released. ISO 14644-16:2019, “Cleanrooms and Associated Controlled Environments — Part 16: Energy Efficiency in Cleanrooms and Separative Devices,” provides guidance and recommendations for optimizing energy usage and maintaining energy efficiency in new and existing cleanrooms, clean zones, and separative devices. It provides guidance for the design, construction, commissioning, and operation of cleanrooms.
Company History and Sustainability
At Roche/Genentech, our business is focused on the pharmaceutical and medical devices that patients need next. Our ambition lies not only in transforming healthcare through innovative solutions, but also in our contributions to environmental protection. Since 2004, Roche/Genentech has been implementing carbon dioxide reduction measures that have led to a 59% absolute reduction in greenhouse gas (GHG) emissions from our own operations and purchased energy (Scope 1 and 2). In that same period, our revenue has more than doubled.3
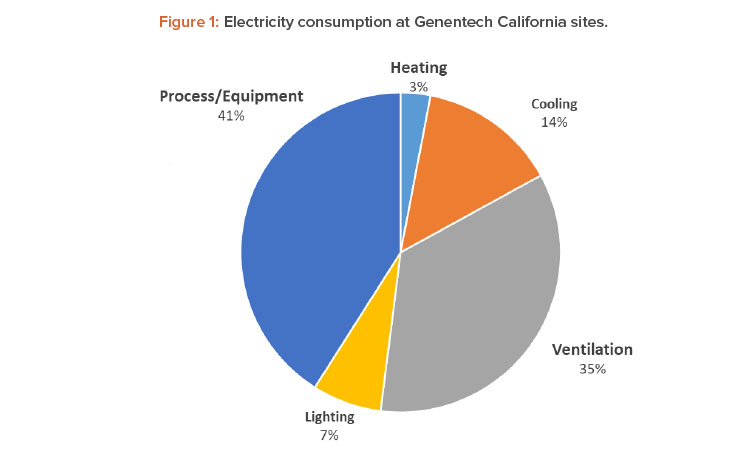
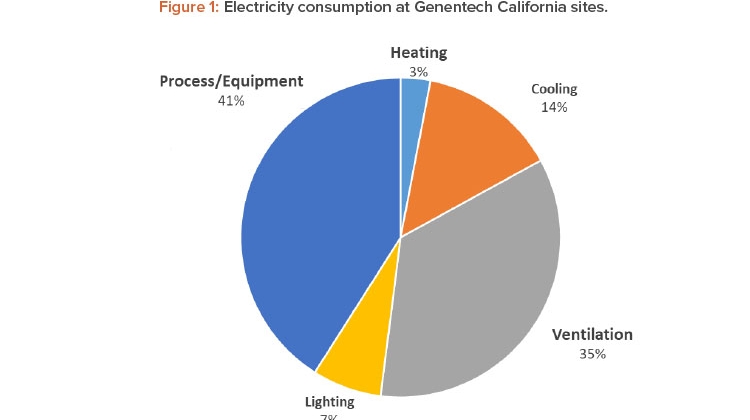
Energy conservation has been a top priority in our GHG emissions reduction strategy. One of the most energy-intensive areas in our pharmaceutical manufacturing sites are cleanrooms, which makes them a great candidate for energy optimization. Cleanroom energy benchmarking studies, in general, show that HVAC energy use in the cleanrooms accounts for 36%–67% of the total facility energy consumption.4 Although the relative percentages vary due to the energy intensity of the process systems, cleanroom classifications, and the climate, HVAC systems are the dominant contributor to the energy intensity in pharmaceutical manufacturing sites (see Figure 1).
Manufacturing Site Survey
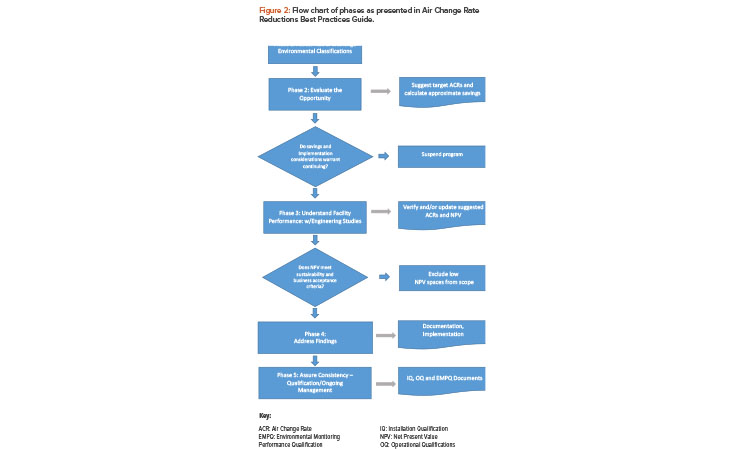
The phased approach in the survey requires both an understanding of the requirements and a sequence of progressively more detailed engineering studies to achieve energy-saving potential with minimal wasted effort. The phases of project execution elaborated in Figure 2 are as follows:
- Phase 1: Assess risk and challenge environmental classifications
- Phase 2: Evaluate the opportunity, including numerical evaluation and screening study
- Phase 3: Understand facility performance
- Phase 4: Address findings and implement
- Phase 5: Assure consistency with qualification and ongoing management
As shown in Figure 2, implementing ACRs can affect the manufacturing process environment. In most cases, changes that affect manufacturing are done when manufacturing is shut down to minimize the risk to the product. However, when the US Food and Drug Administration (FDA) introduced “Pharmaceutical cGMPs for the 21st Century — A Risk-Based Approach”5 in September 2004, the paradigm shifted and these questions were asked: What is the probability that changing the airflow in a given clean area will affect the process or product in that area? What would be the impact to the process or product in that area if the airflow was changing? This new thinking about the risk of change implementation during production eliminates the need for a shutdown. Now the implementation can focus on risk controls.
Site Location
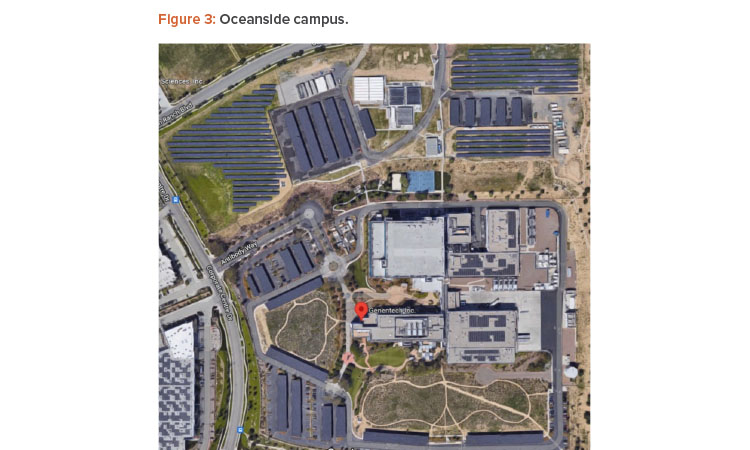
At Roche/Genentech, addressing these questions started in the Genentech facility in Oceanside, California. This facility was chosen because site processing is sealed or can be held in a sealed state for enough time to implement the change in airflow. The goal of this paper is to share that success story of implementing ACR reduction at the Oceanside facility while the cleanrooms were in operation.
Located 35 miles north of San Diego, the Oceanside campus is a multiproduct Chinese hamster ovary (CHO) drug substance manufacturing site with parallel commercial production and launch capabilities that spans 60 acres, with seven buildings and ~575,000 square feet. The facility has 90,000 liters of capacity and is licensed to produce several biological drug substances (see Figure 3). It has 3.5 MW of solar photovoltaic as a combination of ground-mount, car-port, and rooftop panels, with a 1 MW, 2 MWh on-site battery energy storage system (installed in 2016), and a 2.5 MW fuel cell (installed in 2019).
| Overall Results – cGMP Airflow Reduction | |||||||||
|---|---|---|---|---|---|---|---|---|---|
| Space Type | Number of Rooms |
Room Area (ft2) |
Room Volume (ft3) |
Baseline AC/Hr |
Baseline Air flow (CFM) |
Reduced AC/Hr |
Reduced Air flow (CFM) |
Air flow Savings (CFM) |
Energy Cost Savings ($/yr) |
| BZ 2 | 13 | 3,911 | 54,681 | 37.3 | 38,824 | 32.4 | 33,833 | 4,991 | $22,000 |
| BZ 2A | 8 | 648 | 5,832 | 39.1 | 3,677 | 36.3 | 3,475 | 202 | $1,000 |
| BZ 3.1 | 70 | 38,917 | 618,790 | 28.9 | 241,110 | 16.6 | 169,169 | 71,941 | $312,000 |
| BZ 3.1A | 43 | 4,200 | 39,927 | 28.5 | 17,079 | 23.0 | 15,103 | 1,976 | $9,000 |
| BZ 4.1 | 33 | 21,413 | 206,353 | 26.0 | 83,324 | 12.3 | 44,457 | 38,867 | $169,000 |
| BZ 4.1A | 5 | 558 | 5,258 | 25.3 | 2,360 | 15.4 | 1,340 | 1,020 | $4,000 |
| cGMP Total: | 172 | 69,647 | 930,841 | 24.9 | 386,374 | 17.2 | 267,377 | 118,997 | $516,000 |
| Other* | 92 | 213,589 | 4,294,647 | 3.2 | 232,012 | w/ 20% Contingency: | 95,198 | $413,000 | |
| Building Total: | 264 | 283,235 | 618,386 | ||||||
*Primarily unclassified spaces
A consulting company conducted studies that showed potential for reduction of over 297,000 therms of natural gas and over 2,439,000 kWh of electricity, which would result in more than 2,400 metric tons of CO2 reduction per year. This is over 10% of site energy consumption and GHG emissions, with more than $400,000 savings per year. The calculation was based on 2018 utilities rates, shown in Table 1, assuming annual cost of energy for each cubic foot per minute (cfm) at $4.33. This presented a great opportunity to pilot ACR reduction during operation for the entire network.
Stakeholders and Management
The next step was developing a participation matrix to identify stakeholders and their involvement throughout the project life cycle. Qualification support and internal quality control and validation buy-in were a crucial part for the implementation. The final push was when the site’s general manager and head of quality came to the team meeting to endorse the parallel implementation of the change during production.
This show of support from upper site management was both a unifying and liberating factor for several team members who were hesitant to believe we would perform a change and then “run at risk” during a short revalidation period. By removing the age-old constraints for quality, validation, manufacturing, and engineering, the team was able to truly get into the details of the risks and the risk controls we could use.
Implementation
The overall policy for risk-based activity has been stated in global standards for over 10 years. The questions of risk tolerance are really, “How much risk are we willing to take?” And in scenarios of higher risk, “Are we to lean toward being risk averse or are we willing to let the data determine true success or failure?” Parallel implementation was chosen due to the following reasons:
- No mechanical modifications were performed on the air handling unit (AHU) to provide reversibility.
- ACRs were not modified in the production areas until the validation of the BZ 4.1 (biozone) nonproduction areas was successfully executed.
- For production areas with open operations, air balancing was not performed during the open operations.
- The successful qualification of the expansion production areas provided additional assurance that operating under reduced ACRs provides a controlled environment that meets Roche/Genentech requirements.
The implementation scope was strictly limited to air balancing. The only way to put the air balance “back the way it was” was to spend the extra time up front, documenting the precise air balance the system had the minute before changes were made. We spent the time to fully survey the airflow at every supply and return grille individually and recorded it by device number. All the air handlers’ main ducts for inlet, outlet, makeup, and exhaust were traversed to meet this requirement and to achieve reversibility. This was very useful for pressure balancing because the amount of makeup air remains virtually constant when the recirculation rate decreases. Therefore, the pre-reads with no “physical” modifications provide for complete reversibility.
The second restriction was to perform the changes for the first five of the 15 systems on those where no production activities even occur. These first five systems served a personnel stairwell from the first floor locker rooms to the second and third floors, first floor corridors, second floor corridors, third floor corridors, and equipment staging and storage areas outside the production rooms. This limits the risk because there is no process or product to be at risk. The other benefit of selecting these first five systems to pre-read, reduce the air balance, and then revalidate first was to build confidence and experience. This was a gate review for showing the project was ready for “prime time” in the production areas.
Each of the 15 cleanroom air systems were a “mini-project” within the overall project. Each required a pre-read air balance, implementation of the new reduced air balance, post-implementation readings for validation of the new configuration, daily sampling for nonviable particulates (NVP), daily sampling for viable air particulates, daily sampling for surface contamination for the revalidation period assessed, and data review by quality control, validation, and quality engineering departments to create final deviation reports for validation and quality engineering approvals, which leads to the next restriction.
Only one of the 15 systems was allowed to be “in process” at any given time. This was beneficial to the overall project in two ways: focus on the team and enabling the team to be smaller. Nothing is more distracting than unfinished or open issues while you are working on something else. Each system got the full attention of the team from start to finish. The team was a consistent set of subject matter experts. Whether for writing the protocols for validation or taking the samples, the same small set of people were involved, which contributed to consistent results. At this point the team has five systems completed, with validation approved, that were returned to service under their belt. They were ready for prime time.
The next restrictions were focused on even more protections for production areas. It started with scheduling of open process activities. For the du-ration of pre-reads and the implementation of the reduced air balance, that area could not perform any open processing. Once the final validation air balance readings were completed, open operations were allowed “at risk” until the full validation process was completed. Note that sampling is not normally performed during an open process, even for a validated space.
The next change is in added testing because of open operations. For production areas where open activities are performed, a “recovery test” was completed at each location where an open activity occurs during processing. This was done by bringing in specially trained cleanroom certification personnel and allowing them to use a particle generator at each location. The generator was used to spike particles of 0.5 micron just above the ISO 8 limit for the area, then the generator was shut down while an NVP sampling machine recorded the reduction in NVP every 30 seconds until the airborne level reached 10% of the ISO limit, or 1 log reduction. For the test to pass, the area must recover from over 100% to under 10% in a specified time.
In the end, all the restrictions reduced the risk of each and every segment. As we have discussed, some areas are inherently riskier. Because we needed to formalize this in a GMP change process, we needed a cross-functional team to develop a qualification project plan (QPP) to detail the HVAC equipment (commissioning/operational qualification), environmental monitoring performance qualification strategy, and requirements for existing systems impacted by the HVAC ACR reduction. The team broke the project down into the 15 systems based on areas served by an AHU. The impacted AHUs and areas had individual ACRs as subprojects and thus limited the active scope, and concurrent risk for all aspects, to a single system at any given time.
Risk Assessment
A quality risk management report (QRMR) was developed to determine the number of days to perform modified environmental monitoring performance qualification (EMPQ). Under the associated quality risk management plan, the potential risks posed by the ACR on the facility, processing, and/or product were examined and assessed.
The risk assessment process included:
- Data gathering (e.g., room number, HVAC classification diagrams)
- Risk assessment questionnaire to calculate risk score (standard risk matrix)
- Risk matrix for number of days to perform modified EMPQ
- Summarization of risk scoring data
The team came up with three simple quality categories—low risk, medium risk, and high risk—proving that the distinctions do not have to be fancy or complex.
The quality categories can be broken out as follows:
- Low risk: HVAC systems supplying areas that have no processing. These are primarily corridors and secondarily staging areas for equipment or supplies. Nothing is allowed to be “opened” per standard operating procedure (SOP), as far as product or materials for product.
- Medium risk: HVAC systems supplying processing areas that are closed processes. These are areas where the product or process is fully contained within a tank or piping that is never allowed to be opened per SOP.
- High risk: HVAC systems supplying processing areas that have open processes. Most of these are momentary but still require that the environment be clean enough to meet the licensed process requirements and not cause contamination that would result in unusable products.
The follow-up for validation was to assign the appropriate number of sampling days for each type of system based on the risk categories:
- Low risk: Requires the least amount of environmental monitoring (EM) sampling and monitoring after the new air balance is completed.
- Medium risk: Requires a moderate amount of EM sampling and monitoring after the new air balance is completed.
- High risk: Requires the largest amount of EM sampling and monitoring after the new air balance is completed and includes special testing of recovery time within three feet of the location where an open process will be performed.
The validation engineer wrote the requalification protocols from these categories. It was agreed that only one system would be qualified at a time. Starting the next system was dependent upon the successful final approval of all validation results.
The new air balance values for all the systems were estimated based on two factors. The first factor is industry research to ensure success is highly likely and starts at more than 10 ACH for ISO 8. The other factor is “turn down” of the existing system and limits to their sizing. Our systems were designed for 25 ACH and so attempting to get down to 6 or 8 ACH was not likely.
We also came across circumstances where rooms could not be optimized down. For example, there was a very long corridor with all south-facing windows. In this case, 10 to
12 ACH would have been optimum, but during the day after the initial balance, both temperature and pressure was unstable in that corridor due to solar gain. We had to increase the ACH to 14 to overcome the solar gain factor. It was combining these factors that allowed engineering and the air balancers to set realistic goals for the area by ISO class:
- Low-risk ISO 8 system: From 25 ACH to 12 ACH +/- 1
- Medium-risk ISO 8 system: From 25 ACH to 14 ACH +/- 1
- High-risk ISO 8 system: From 25 ACH to 16 ACH +/- 1
- High-risk ISO 7 system: 48 ACH to 28 ACH +/- 1
The project was completed in 2020. The implemented changes reduced air flow volume by 165,000 cfm—which was 38% higher than initial estimates presented in Table 1—and resulted in a 14% decrease in energy consumption and GHG emissions and over $678,000 cost savings per year. With significant energy cost increases in 2021 and 2022, the potential cost savings are much higher than the estimated values.
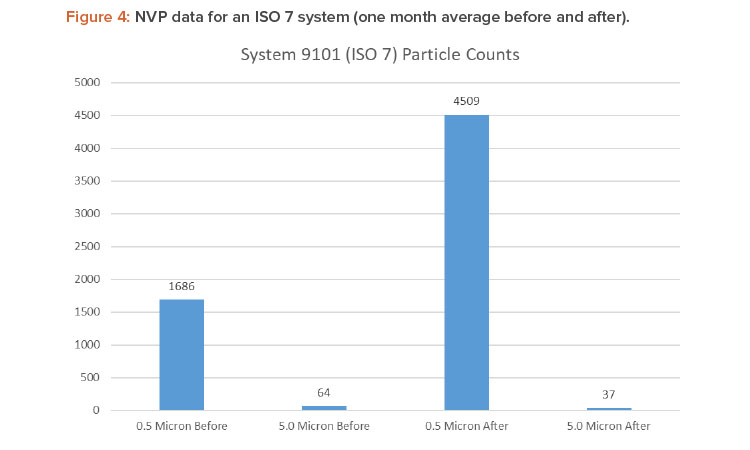
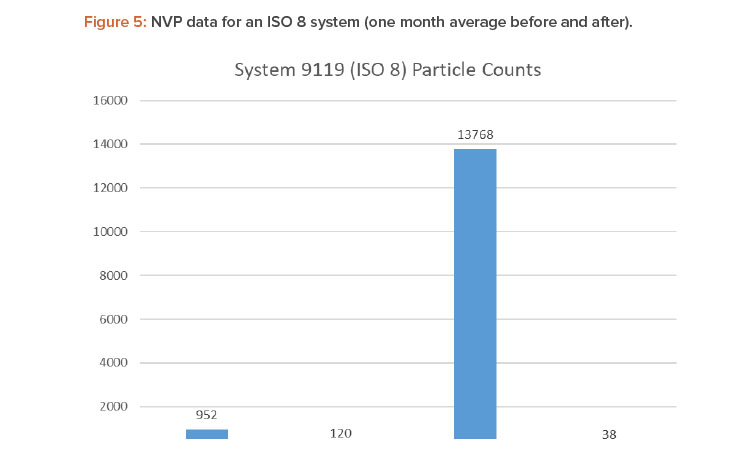
Figures 4 and 5 show the differences in 0.5- and 5.0-micron particulates found by air sampling before and after the air change reduction for an ISO 7 and ISO 8 (medium risk) system.
Conclusion
This project was a multidisciplinary success, with representatives from manufacturing, scheduling, quality control, quality assurance, validation, facilities, engineering, and project management, as well as HVAC subject matter experts, EM samplers, air balancers, and cleanroom testing certification technicians, all are responsible for the cleanroom environments and yet made a great example of innovative approaches to enable such changes in an environment where continuous production is a key for patients.
Available in Russian | |
| Снижение скорости воздухообмена во время эксплуатации: успех компании | |
Individual Download Скачать сейчас! | |
About the Authors


