Continued Process Verification in Stages 1–3

Continued process verification (CPV) as defined in the US FDA process validation guideline
Continued Process Verification in Stages 1–3: Multivariate Data Modeling Using Design Space and Monte Carlo
The approach can use virtually any kind of data source to build the design space, including first-principle dynamical models, design of experiment (DOE) models, clinical trial batches during process performance qualification (PPQ), and historical batches in a production historian. This approach can provide a smooth transition from the research and development (R&D) first-principle model to the permanent continued process verification program for commercial production throughout the drug development cycle.
The FDA recommends a three-stage approach to process validation. As the US pharmaceutical industry regulator, the FDA has been driving science- and risk-based approaches for almost a decade through documents such as the process validation guidance published in 2011.1 The guidance fundamentally affects process development, engineering practice, and commercial production for drug substances and drug products. A new commercial manufacturing process should go through stage 1, process design; stage 2, process qualification; and stage 3, continued process verification. Whereas stage 2 retains most procedural elements from traditional qualification and validation (such as installation qualification, operational qualification, performance qualification, and process validation), stages 1 and 3 involve many science-, risk-, and statistics-based approaches, such as risk assessment, design of experiment, statistical process control (SPC), and processing capability (Cpk) evaluation. The FDA now recommends stage 3 for all commercial processes because it provides the ultimate evidence that a process is running under a state of control.
The FDA’s process validation guidance1 also emphasizes statistics. Sponsors are encouraged to identify critical process parameters (CPP) and critical quality attributes (CQA) through risk assessment according to the quality target product profile (QTPP) and evaluate them using statistical approaches such as design of experiment early in stage 1. The historical standard of three consecutive batches may no longer be sufficient for chemistry, manufacturing, and controls (CMC) submission. The FDA is now considering the entire drug development approach, how much product and process understanding the drug manufacturer has demonstrated, and statistical evidence that the process is running as designed and in a state of control. Including continued process verification as part of chemistry, manufacturing, and control submission is therefore highly recommended.
Continued process verification is now included as part of annual product review. Statistical process control charts and Cpk analysis are the most common tools used incurrent continued process verification programs. They are univariate methods and are usually used after batch completion. Statistical process control charts for quality attributes are usually used to evaluate processing capability and may also be used to assess control capability for specific process parameters. Cpk analysis evaluates control system capability by monitoring variation of the process parameters. From a statistics standpoint, far more than three batches will usually be needed to sufficiently analyze process capability of both process parameters and quality attributes. Therefore, a continued process verification program using univariate tools would usually not be established until phase 3 commercial production.
Because of its complete statistical analysis capability, multivariate data analysis is sometimes used to better understand the correlations between the critical quality attributes and critical process parameters in place of statistical process control and Cpk. Such analysis would, however, still have to be done after batch completion, and extensive modeling and computation would usually be involved. The obvious advantage of multivariate data analysis is its ability to count the interactions between multiple process parameters that a univariate approach would fail to detect.
In following sections, an online multivariate data analysis–based approach is introduced to allow continued process verification to be planned as early as stage 1; this approach can make continued process verification an integral part of process validation throughout stages 1, 2, and 3. It provides not only the ability to statistically evaluate the correlation between the critical quality attributes and critical process parameters but also the ability to detect process fault and predict critical quality attributes in real time.
Online Multivariate Data Analysis
Online multivariate data analysis is a relatively new data analytics technology that can be used for continued process verification. Online multivariate data analysis is based on the traditional multivariate data analysis methodology and a batch simulation scanning concept. Before we discuss the challenges of implementing continued process verification for the entire drug development cycle, let us briefly review how online multivariate data analysis can be achieved.
Batch Simulation Using Multivariate Data Analysis
Multivariate data analysis is a powerful improvement to the current univariate approach in continued process verification and is recommended by many industrial experts.2 Primary component analysis (PCA) and projected latent structure (PLS) in multivariate data analysis are highly recommended in data analysis. With modern computing power and iterative primary component analysis/projected latent structure algorithms, both enumerative and analytical statistics can now be achieved efficiently online in real time.
How can multivariate data analysis be used for a batch process, which is dynamic and can’t be directly analyzed with multivariate data analysis?
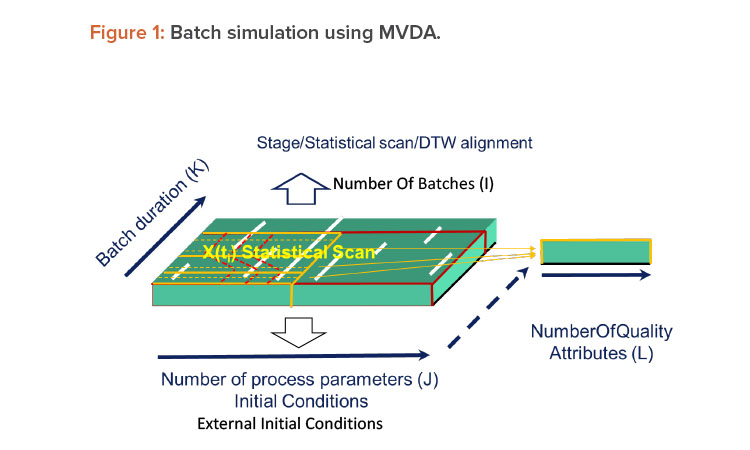
Multivariate data analysis is complicated with its high number of dimensions, but batch simulation is complicated in its own way because of its dynamic nature. Batch simulation using multivariate data analysis requires an additional concept or data structure. Such a data structure would allow for sufficient description of any batch process in a time-evolving fashion. In practice, multivariate data analysis modeling for batch would involve scanning a batch process into many frames over the batch duration (Figure 1). These frames are called statistical scans. The statistical scan averages the process conditions between two nearby frames. A batch process can be represented by many statistical scans that are sometimes separated into several groups called stages.3
Within the stages, statistical scans may need to be appropriately aligned from batch to batch. One of the challenges of batch simulation is that batches may be of different durations and pauses/holds may occur during them; therefore, the alignment of statistical scans can’t be based on time only. A well-accepted approach to addressing this challenge is an algorithm called dynamic time warping (DTW). Dynamic time warping is an optimization that looks not only at the time but also the physical characteristics—such as process parameters—of a batch process to determine the alignment of the statistical scans.4
Batch multivariate data analysis models contain hundreds of multivariate data analysis models that are lined up at different time frames in the scanning structure. The amount of modeling in a batch simulation is a hundred times greater than what would usually be modeled in an research and development project. Batch simulation with multivariate data analysis is not be feasible without an automated platform.
Automating Multivariate Data Analysis
Multivariate data analysis can be fully automated online to provide real-time analysis thanks to the modern computing power of servers, the standardization of plant models as defined in ANSI/International Society of Automation (ISA) Standard S88,5 and digitization of almost all process parameters and initial conditions. Algorithms such as NIPALS, which is an iterative decomposition algorithm for matrix data, make primary component analysis/projected latent structure an effective online method for analyzing large amounts of data and building multivariate data analysis models.
Another important foundational piece of online multivariate data analysis is the algorithm to align statistical scans from batches of different durations. One of the most popular approaches is to use DTW, which takes a certain number of adjacent statistical scans into consideration during alignment. Multivariate data analysis models can therefore be generated automatically from historical data in manner similar to the way Google performs an internet search.
Online multivariate data analysis is an integrated part of many common process control systems, such as distributed control systems (DCS). An online multivariate data analysis platform positioned on top of historians includes a model builder, an analytics server, and a monitoring server (Figure 2). The model builder builds multivariate data analysis models from historical data. The monitoring server uses appropriate multivariate data analysis models to evaluate the actual performance of a real-time process and predict batch quality. The online multivariate data analysis platform sits on top of a process control system at level 2.5 or 3 in the International Society of Automation S95 hierarchy.
Online multivariate data analysis incorporates built-in model-building tools such as primary component analysis and projected latent structure as well as a real-time monitoring server based on the International Society of Automation S88 structure to provide the capability to detect faults and predict quality in real time. The fault detection and quality prediction windows are essentially the automated form of continued process verification, continuously measuring real-time process against the design space.
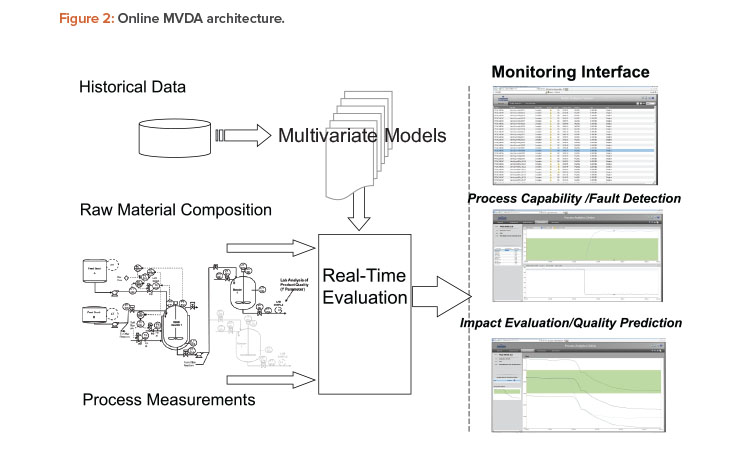
Compared to traditional biplots in primary component analysis, normalized T2 and Q (between 0 and 1) are a more statistically robust method to identify irregularity and ensure a process is running under a state of control. In addition to providing enumerative statistics such as those used in continued process verification, online multivariate data analysis provides real-time monitoring functions such as process fault detection and batch final quality prediction.
In Figure 2, the middle window on the right illustrates how the monitoring service performs statistical tests on process parameters, specifically on T2 and Q based on primary component analysis. Statistically improbable behavior will be called out. Specific contributions from different process parameters can be further investigated from the same window by clicking the process parameter contribution on the left. The bottom window on the right shows the quality prediction (middle line) for the real-time batch. The top and bottom lines represent the upper and lower limits, respectively, of the prediction, all at 95% confidence level. Operators may be trained with standard operating procedures to use the fault detection and quality prediction tools to intervene in the process when required.
Implementation Challenges
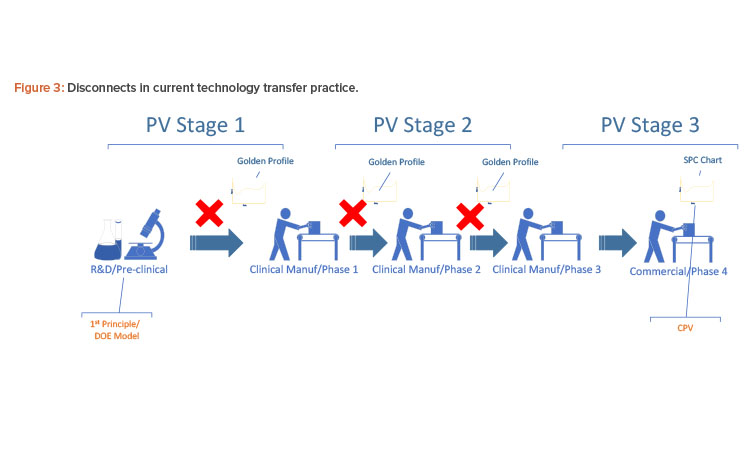
Figure 3 shows the landscape of process simulation and current continued process verification practice in the pharmaceutical industry. Implementation of a golden (i.e., ideal) batch profile is desirable to comply with industry regulations and achieve operational excellence. The challenge, however, has been the disconnect between the dynamic nature of the research and development first-principle model, the statistical nature of design of experiment design space, and the actual discrete data from real-time processes. Most of the current control platforms do not allow the manufacturer to set a golden batch profile as the background for batch operations, particularly at process start-up. In the case where a golden batch profile with standard deviation can be provided by the historian, such monitoring is usually univariate and not statistically meaningful enough to detect fault or predict quality.
Design space is the common thread that connects all these pieces together, but there has been no common form for representing it from stage to stage. The pharmaceutical industry generally lacks platforms that can fully integrate research and development, technology transfer, clinical manufacturing, commercial operations, regulatory compliance, and manufacturing intelligence.
The online multivariate data analysis model has been successful with production monitoring, but implementing it for continued process verification throughout the phases is challenging. It takes far more than three actual batches to build a multivariate data analysis model through primary component analysis/projected latent structure; therefore, multivariate data analysis historically could not be used in early stages because there were not enough batches. Furthermore, the research and development design of experiment design space and first-principle mechanistic models early in process development can’t be directly used for building the multivariate data analysis model because such equations can’t be included in a multivariate data analysis platform. Most multivariate data analysis online platforms do not take in loose data or equations for model-building. Thus, continued process verification in current practice is mostly statistical process control charting and quality parameter trending at clinical phase 3 and commercial phase 4, and is completely disconnected from earlier stages.
Implementing Design Space Using Monte Carlo Simulation
An application of Monte Carlo simulation and open data sources for multivariate data analysis model-building can bridge the gaps discussed previously. It allows online multivariate data analysis to be a solution throughout the entire drug development cycle from process development to commercial production, and that solution is applicable to the entire plant.6
Although batch history data are highly structured in the historian, they can also be randomly simulated as new batches within the design space. With a Monte Carlo simulation framework, the design space and a reference batch can be used to construct as many batches as desired. The parameters required in the Monte Carlo simulation are the approved parameter range, the parameter control capability, and a reference batch.
The simulated batches are initially used to build the multivariate data analysis model and gradually replaced with real batches from commercial production to rebuild the model. In this way, the multivariate data analysis model improves over time. Continued process verification can be achieved when all simulated batches are replaced with real batches.
Allowing the use of open data sources means that the model definition can be defined not only through the batch historian but also through International Society of Automation S88 hierarchy exported from a distributed control system or other control systems, separate batch data files, and batch event files. This means third-party historians and even data from a first-principle mechanistic model can all be used for multivariate data analysis model-building on such platforms.
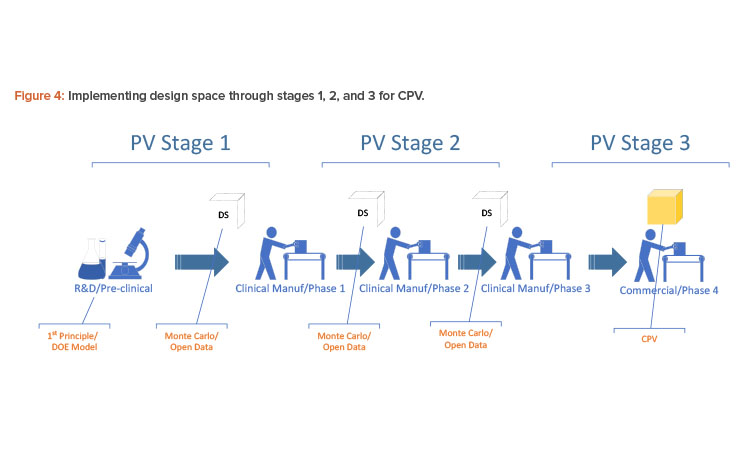
The way to implement a first-principle or design of experiment model for production is not to take in the equations directly but to take in a sufficient amount of data from the design of experiment or first-principle equations for the multivariate data analysis model to learn. When a process is transferred from one phase to the next, the design space may have to be transferred using Monte Carlo simulation with an open data source because the process will be built anew at a different scale (see Figure 4).
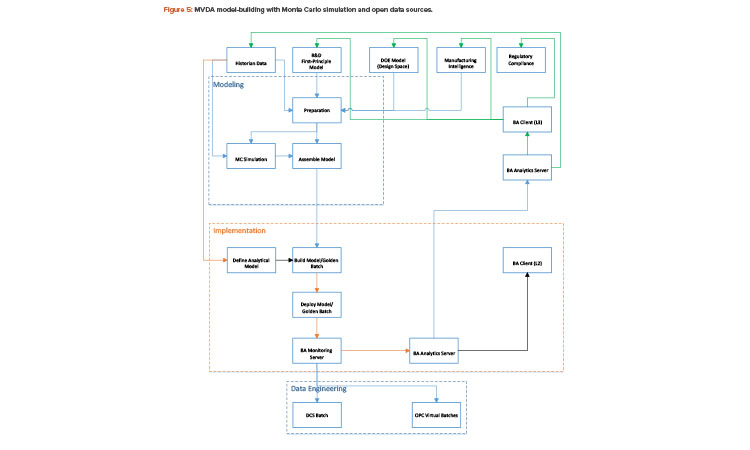
With the Monte Carlo capability and the open interface in building batch context, any golden batch profile or design of experiment design space—regardless of where it came from—can be implemented as a multivariate data analysis model for process monitoring. Figure 5 shows how a multivariate data analysis model may be constructed and deployed using the Monte Carlo method and an open data source.
The multivariate data analysis model, in this case, can be built from the historian, the design of experiment models, or first-principle models. If simulated batches are needed for model-building, Monte Carlo simulation must be performed to generate such batches before a complete multivariate data analysis model can be assembled. Process parameters and quality attributes must then be defined for the batch, and primary component analysis/projected latent structure are run to generate the specific characteristics of the multivariate data analysis model, such as eigenvalues, loading, and scores. The multivariate data analysis model can then be deployed to the specific control platform for real-time monitoring. This effort must be coordinated with plant automation. As shown in Figure 5, the foundation for multivariate data analysis model deployment and model-building is data connectivity within the plant.
Implementing Online Multivariate Data Analysis for the Entire Plant
From a business standpoint, implementation of online multivariate data analysis involves two challenges: First, the manufacturer wants to find an analytics solution for the entire plant, if not the entire enterprise. Second, the solution should function not only as an operation support tool but also as a manufacturing intelligence tool that supports business decisions.
Thanks to the Open Platform Communications (OPC) connectivity standard, the multivariate data analysis online platform can be applied to all control systems in a plant. Most modern control systems have open connectivity, such as OPC, which can allow the control system to have virtual batches in the multivariate data analysis online platform; those virtual batches can then be monitored just like regular batches by online multivariate data analysis solutions.
Multivariate data analysis models can be built for a specific product on a specific unit. The multivariate data analysis online platform can therefore be used for multiple products on non-designated equipment.
Multivariate data analysis can be a powerful tool for both operations and business decisions. Multivariate data analysis analytics can be used for decision support, manufacturing intelligence, or quality assurance for business improvement. Most multivariate data analysis online platforms have the capability to work across different domains and can be configured through network firewalls.
Multivariate data analysis analytics can be used for decision support, manufacturing intelligence, or quality assurance for business improvement.
Implementation Cost of Online Multivariate Data analysis
A Multivariate data analysis online in a production environment is generally assumed to be expensive because of multivariate data analysis licensing costs and the complexity of project implementation. Although online multivariate data analysis is by far one of the most powerful analytics tools available, the threshold for adopting it is still high.
Implementing multivariate data analysis throughout a drug development pipeline requires long-term collaboration among experts in operations, process engineering, automation, statistics, data sciences, and information technology (IT). For example, experts in IT must help with data connectivity, and model-building requires process-modeling and statistics knowledge.
Online multivariate data analysis licensing costs may vary significantly from vendor to vendor. Some multivariate data analysis online solutions have been highly integrated with a particular control system, which could reduce the implementation threshold for that control platform; however, integration with third-party control systems may be difficult.
Case Study
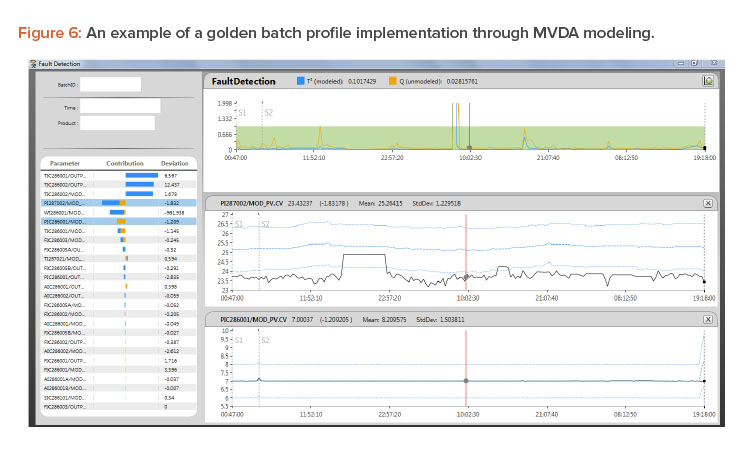
Figure 6 shows a golden profile/multivariate data analysis model built from a reference batch and a design space. This ideal batch profile is an active statistical model simultaneously used for statistical evaluations of the actual running batch based on T2 and Q, as explained previously. When the running batch is not performing normally, T2 and Q will signal that issue by showing the values moving out of the green area.
A production process, 5K bioreactor cell culture batch, in a large US pharmaceutical manufacturer’s facility was used as a proof of concept for this approach to implementing design space using Monte Carlo simulation. Simulated batches were generated using the Monte Carlo method based on reference historical data from an IP21 historian and a design space available from earlier development work.
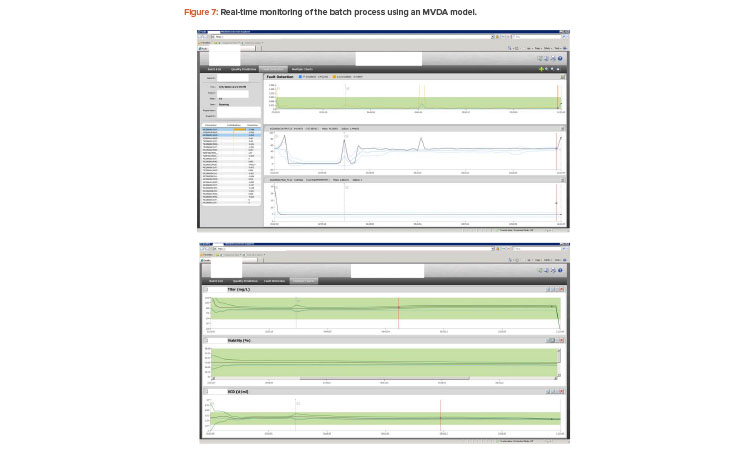
The simulated batches were then used to build a multivariate data analysis model, which included 26 process parameters as the process input and three quality attributes as output. The model was then successfully deployed for online real-time monitoring in production. The monitoring results are shown in Figure 7.
The multivariate data analysis statistical model calculates T2 and Q on a periodic basis to monitor real-time batch processes. Essentially, the real-time batch is being constantly measured against its design space, which is represented by the multivariate data analysis model built through Monte Carlo simulated batches.
The top windows in Figure 7 show T2 and Q for fault detection of the process conditions. The bottom window shows the conventional univariate golden profile or historical behavior for one of the selected process parameters. T2 and Q statistics plus the univariate golden profiles are the design space of the process, which can then be used to measure the running batch in real time.
As more batches are completed, the multivariate data analysis model is rebuilt with the new batch history data as part of the training or testing batch data set. This rebuilding process continues until all simulated batches are replaced with real batch history data.
Conclusion
Online multivariate data analysis is emerging as the solution for continued process verification throughout the drug development cycle, connecting stages 1, 2, and 3 and allowing continued process verification to be included early in the drug development life cycle.
Design space is the common thread that connects stages 1, 2, and 3 in process validation. Multivariate data analysis modeling with Monte Carlo simulation and an open data source for model-building is one of the approaches moving the design space of the drug-making process from stage to stage and from phase to phase to achieve continued process verification, as the FDA recommends in its process validation guidance.
Although equations from first-principle and design of experiment models can’t be used by a multivariate data analysis platform, first-principle models and design of experiment design space can be used to provide the data that the multivariate data analysis model builder uses to learn about the design space of the first-principle or design of experiment model.
The online multivariate data analysis solution is particularly suited for handling large amounts and complicated sets of data in plantwide applications, and it can be applied to different control platforms with OPC connectivity. Analytics by online multivariate data analysis can support not only operations but also quality assurance, compliance, and manufacturing intelligence.
Online multivariate data analysis can be used for continued process verification throughout the drug development cycle, connecting validation stages 1, 2, and 3. It is arguably the future direction of process monitoring in the pharmaceutical industry.
Additional Resources
Abdi, H., and L. J. Williams. “Principal Component Analysis.” Wiley Interdisciplinary Reviews: Computational Statistics 2, no. 4 (2010): 433–459.
Bengio, Y., A. Courville, and P. Vincent. “Representation Learning: A Review and New Perspectives.” IEEE Transactions on Pattern Analysis and Machine Intelligence 35, no. 8 (2013): 1798–1828. doi:10.1109/TPAMI.2013.50
Jolliffe, I. T. Principal Component Analysis. New York: Springer-Verlag, 2002.
About the Author