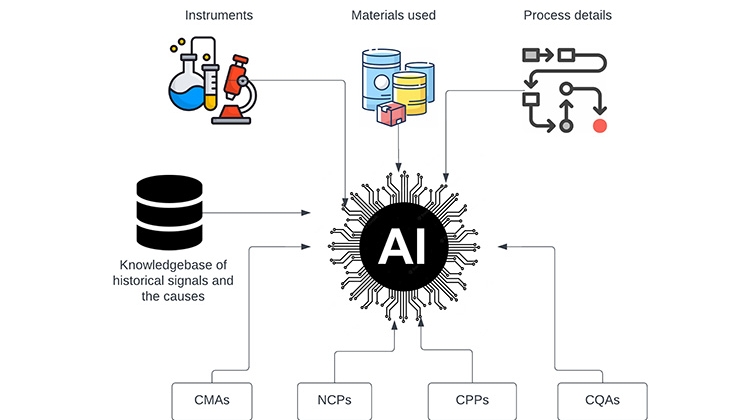
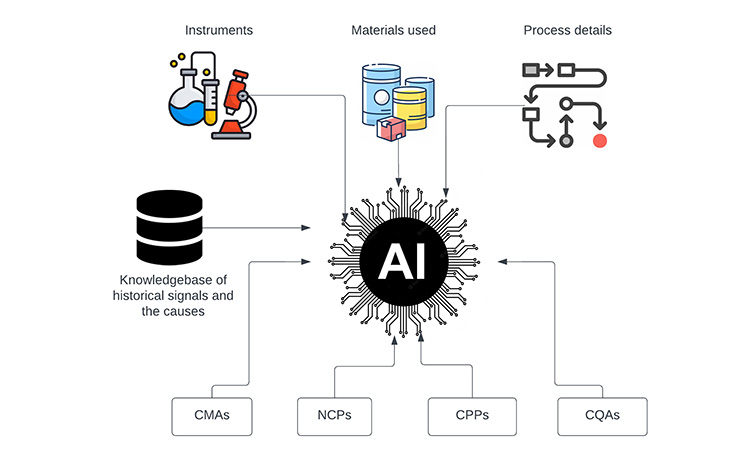
Table 1 comprises of different machine learning models that can be applied for the CPV program. This can be used to automate the data analysis and suggest relevant actions to improve production processes.
Table 1: Different Machine Learning models that can be used for CPV Analysis
| Machine Learning Models |
Description |
Application in CPV program |
| Time Series Regression |
Time series regression is a statistical modeling technique used to analyze and predict data points over time. It extends the concept of linear regression to scenarios where the independent variable(s) are time-ordered, allowing you to model and make predictions based on the temporal component of the data. |
Time Series Regression can be used to predict the upcoming data trend and future process behavior. Time series regression in CPV provides a data-driven approach to understanding and managing manufacturing processes over time. |
| Random Forest |
Random Forest is an ensemble learning technique that combines multiple decision trees to make more accurate predictions and identify important features in the data. |
Random Forest models provides interpretability of different characteristics through feature importance ranking that can aid in identifying influential process parameters. |
| Support Vector Machine (SVM) |
SVM is a supervised machine learning algorithm used primarily for classification tasks, although it can be extended to regression as well. |
SVM can be used in handling non-linear relationships between process parameters and effective in high-dimensional parameter cases, making them suitable for complex manufacturing processes with numerous variables. |
| Neural Network (NN) |
Neural networks with multiple hidden layers, known as deep neural networks (DNNs), are capable of learning intricate representations of data. |
NN method has the flexibility to model various data types, including time series, images, and text that can be useful in analyzing larger datasets and high dimensional process features. |
| AutoRegressive Integrated Moving Average (ARIMA) |
ARIMA models can be used to identify anomalies in time series data by forecasting future values and comparing them to observed values. |
ARIMA models are particularly useful when dealing with time-dependent data, which is common in CPV as it allows you to predict future process behavior based on historical data. |
| LongShort-Term Memory (LSTM) |
LSTMs are a type of RNN that can capture long-range dependencies in data and are commonly used for anomaly detection. |
LSTM models can capture long-range dependencies in sequential data, which is essential for modeling complex manufacturing processes with multiple input features. This model can handle various types of time series data, including irregularly sampled data or data with missing values. |
| One-Class SVM (Support Vector Machine) |
One-Class SVM aims to separate data into a 'normal' class and an 'anomalous' class, making it useful for binary anomaly detection. |
One-Class SVMs are unsupervised and do not require labeled anomaly data during training and it can detect deviations from expected behavior in manufacturing processes. |
| Gaussian Mixture Models (GMM) |
GMM is a probabilistic model used in machine learning and statistics for representing and clustering data. It is particularly useful when the underlying data distribution appears to be a combination of multiple Gaussian (normal) distributions |
Has ability to provide uncertainty estimates, allowing the user to quantify the confidence in anomaly detection and Adaptability to various types of manufacturing processes and data |
| Isolation Forest |
This algorithm creates a forest of random decision trees and isolates anomalies as data points that require fewer splits to be separated |
Isolation Forest is fast and scalable, making it suitable for real-time anomaly detection in large datasets. It can provide early alerts for process variations, contributing to enhanced product quality and process control. |
| Autoencoders |
Neural network-based autoencoders can learn to reconstruct input data and flag data points with high reconstruction errors as anomalies |
Autoencoders are a versatile tool in Continued Process Verification (CPV) for anomaly detection, data reconstruction, and feature extraction. |
Model Maintenance and Validation:
Based on the tasks and goals of the AI model, there are some metrics that can be used to evaluate performance. Changes to the data sets like adding new parameters, data drifts or shifts can significantly impact the model’s performance, so it is recommended to periodically evaluate the model and fine tune it.
Regression Tasks:
The model that is used to predict the future trends based on the interrelationships between the parameters can be evaluated based on the below criteria:
- Mean Absolute Error (MAE): The average absolute difference between predicted and actual values.
- Mean Squared Error (MSE): The average squared difference between predicted and actual values.
- Root Mean Squared Error (RMSE): The square root of MSE, providing a more interpretable metric in the same units as the target variable.
- R-squared (R²): Measures the proportion of the variance in the target variable explained by the model. It ranges from 0 to 1, with higher values indicating a better fit.
Classification Tasks:
The model that is used to classify the process outputs into different classes that helps the cross functional team to decide on the course of actions can be accessed based on the below criteria:
- Accuracy: The ratio of correctly predicted instances to the total number of instances. It's a fundamental metric for binary and multi-class classification tasks.
- Precision: The ratio of true positive predictions to the total number of positive predictions. It measures the model's ability to avoid false positives.
- Sensitivity: The ratio of true positive predictions to the total number of actual positives. It measures the model's ability to identify all relevant instances.
- F1 Score: The harmonic mean of precision and sensitivity, providing a balance between precision and Sensitivity.
- ROC AUC (Receiver Operating Characteristic Area Under the Curve): Measures the model's ability to distinguish between classes by plotting the ROC curve and calculating the area under it.
Anomaly Detection:
The model that is used to detect the outliers or unusual patterns in the CPV data that might indicate change in process are evaluated based on the below criteria:
- True Positive Rate (TPR): Measures the model's ability to detect anomalies.
- False Positive Rate (FPR): Measures the rate of false alarms in anomaly detection.
- Area Under the ROC Curve (AUC-ROC): Evaluates the overall performance of an anomaly detection model.
Time Series Forecasting Tasks:
The model that is used to predict future process behavior and identify the trends based on the time series data are evaluated based on the below criteria:
- Mean Absolute Percentage Error (MAPE): Measures the accuracy of time series forecasts.
- SMAPE (Symmetric Mean Absolute Percentage Error): Provides a symmetric version of MAPE.
- AIC (Akaike Information Criterion) or BIC (Bayesian Information Criterion): Measures the goodness of fit and complexity of time series forecasting models.
Regulatory Compliance:
Regulatory requirements for CPV can vary depending on the region and the specific regulatory agency overseeing pharmaceutical manufacturing. Most agencies provide clear guidance on the general principles and practices to establish and maintain a validated state for a pharmaceutical manufacturing process. Implementing AI in Pharmaceutical industries creates opportunities but also new and unique challenges. As a result, regulatory agencies started drafting guidelines and regulatory framework that promotes innovation and protects patient safety. Most of the guidelines will be focused on data management, re-training practices, performance/model evaluations and procedure updates.
Future Trends and Challenges:
Continued advancements in Deep Learning Techniques are increasing every day with improved training algorithms and optimization methods. Digitalization will play a crucial role in implementing the AI based CPV process where process and non-process related parameters are captured in real time to enable the understanding of their interrelationship to the product quality. AI models are optimized to run on edge devices enabling real-time processing and decision making in Internet of Things (IoT) applications. When the AI models finds a shift in the data trend or identifies an outlier, it can update the attributes of the IoT devices in manufacturing or recommend a process change or alert the lab to service/replace the analytical device to maintain or improve the quality of the product.
However, implementing AI in CPV process does come with challenges such as the cost of execution, keeping the model updated based on the regulatory guidelines and interoperability in a complex software ecosystem. But these are the growing pains during the transformation as AI continues to evolve and integrate into various aspects of the drug discovery and manufacturing process.
Disclaimer:
iSpeak Blog posts provide an opportunity for the dissemination of ideas and opinions on topics impacting the pharmaceutical industry. Ideas and opinions expressed in iSpeak Blog posts are those of the author(s) and publication thereof does not imply endorsement by ISPE.