Data Analysis of Contamination Control Strategies for Production

On 25 August 2023, the long-awaited revision to Annex 1 became effective, introducing significant regulatory changes, including the requirement of a documented contamination control strategy (CCS). During a workshop at the 2023 ISPE Annual Meeting & Expo, 11 teams of attendees were presented with a risk-based methodology to develop and evaluate CCS elements focused on extrinsic contamination events using the same data set for process and facility. This article presents a summary of the workshop results and a learnings analysis from the evaluation of the data as presented by the 11 teams.
UPDATED ANNEX 1 REQUIREMENTS
Testing Google Survey Embed
The updated Annex 1 introduced significant regulatory changes, including a greater emphasis on quality risk management, detailed requirements for barrier technology, and a widened regulatory scope to cover sterile products. One of the most significant changes was the requirement for a documented CCS that should be implemented across facilities.
The CCS should unify disparate contamination controls into a unified framework in alignment with US Food and Drug Administration (FDA) and Pharmaceutical Inspection Convention and Pharmaceutical Inspection Co-operation Scheme (PIC/S) regulations and guidance documents issued by ISPE, the Parenteral Drug Association (PDA), and International Council for Harmonization of Technical Requirements for Pharmaceuticals for Human Use (ICH).
Current regulatory guidance around a formal CCS includes:
- EudraLex Vol. 4, Annex 1, section 2.3 1
- PIC/S Guidance for Good Manufacturing Practice, Part 1, section 3.62
- WHO, Annex 6 (Good Manufacturing Practices for Sterile Pharmaceutical Products), section 2.3 3
According to Annex 1, the CCS is referred to as a family of documents that unite, evaluate, and record the adequacy of tools used to assure the purity and quality of drug products 1. The heightened focus on the CCS is centered on the physical mechanisms to control intrinsic and extrinsic contamination and emphasizes how the mechanisms work together and are managed as a group.
The Case Study
Testing Microsoft Forms Survey Embed
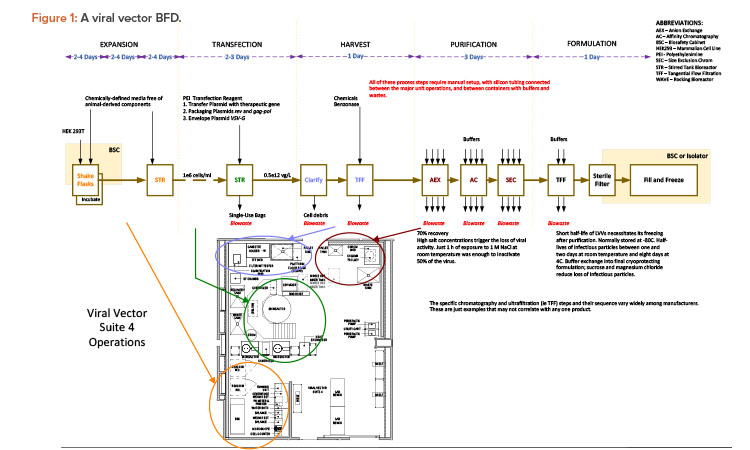
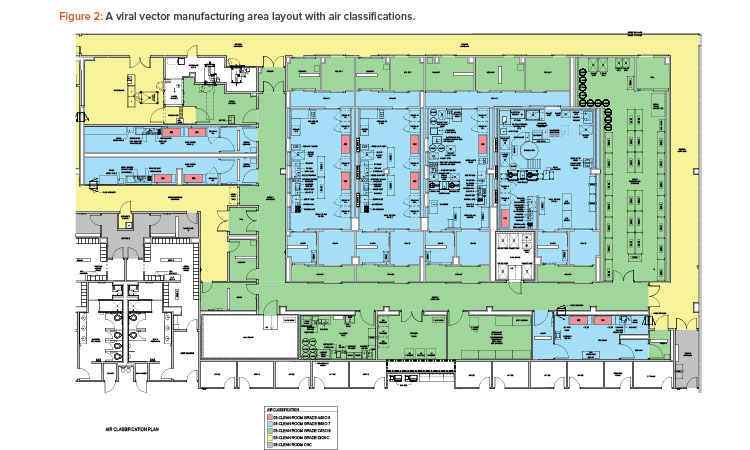
The case study was taken from a new viral vector manufacturing facility used for cell and gene therapy products. The facility was also designed for executing specific T cell therapy manufacturing operations for a targeted 240 patients per year. The T cell therapy operations were based on a worst-case 9-day expansion cycle, at a 24/7/365-day operating cycle. The viral vector operations per suite targeted finished product every 28 to 34 days, again at a 24/7/365-day operating cycle. The process basis for the viral vector manufacturing is represented in the general block flow diagram (BFD) in Figure 1. For clarity, locations of each operation are shown for suite 4 only. These same operations occur in manufacturing suites 1–3 as well. The general viral vector manufacturing area layout is shown in Figure 2. This layout corresponds to the BFD previously identified and includes the associated air classifications for each suite.
WORKSHOP OBJECTIVE
Testing Tally Survey Embed
The Annex 1 revision’s focus on a comprehensive CCS requires a holistic review of contamination sources, identification of risks and control points, and interaction of these elements between all facility attributes. To do this requires a process focused on prevention, remediation, and monitoring. It also requires the analysis of large amounts of data across several different disciplines and the participation of recognized subject matter experts in key areas such as manufacturing, quality control, microbiology, and engineering, as examples.
Testing Qualtrics Survey Embed
The workshop focused on introducing a set of tools that have proven successful in the analysis of the data that make up the root causes of many extrinsic contamination events. The attributers of these events are often heavily influenced by facility design, operational protocols, and the execution of standard procedures impacted by human intervention. Many of these attributes and protocols are common to the majority of manufacturing entities: gowning, environmental monitoring, cleaning, etc.
By establishing a defined roadmap for execution that implements these tools consistently, the resulting analysis of the data should produce a level of consistent results by the majority of those participating in the data analysis. But will that always be true?
EXECUTION APPROACH
Each workshop team was given a set of background documents to understand the case study. These documents included a personnel flow diagram, description of personnel flows, airflow/air classification diagram, description of environmental controls, and BFD of the viral vector manufacturing operation.
Teams were encouraged to ask questions to the facilitators where the material was not clear. However, because it would be impractical to ask a workshop team to read and comprehend a full set of design drawings, operating instructions, corrective and preventative action (CAPA) records, and other data associated with a functional facility, the teams were instructed to make assumptions where needed. For example, a team could assume certain safeguards, such as operator qualification requirements, were in place even if they were not explicitly mentioned in the case study materials.
Ishikawa Diagrams
When developing a CCS, whether for a new or existing process, it is critical to first identify process contamination hazards and understand the associated risk. There are many recognized methodologies and tools identified in ICH Q9 that can be applied to quality risk assessments, such as hazard analysis and critical control points; flowcharts; and failure modes, effects, and criticality analysis (FMECA) 4.
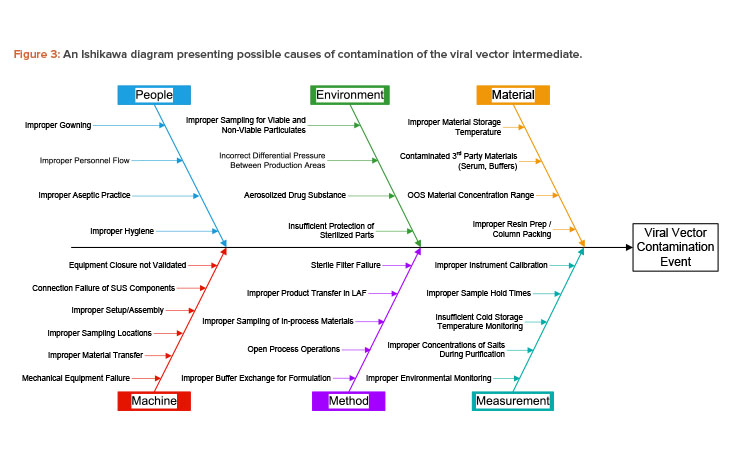
An Ishikawa diagram (also called a cause-and-effect or fishbone diagram) is a flowchart method for process mapping. Ishikawa diagrams provide an easily understood graphical representation of cause-and-effect relationships. Used in combination with brainstorming, they help identify potential causes for a particular effect of interest. Causes are often categorized to form the flowchart paths, or “ribs” of a fishbone. Categorization of paths helps with the brainstorming process to ensure that all relevant aspects of a process are considered.
In the case study, the viral vector produced can be considered an intermediate that is used in production of the T cell therapy drug product. The Ishikawa diagram of the case study lists the effect of interest as contamination of the viral vector intermediate. Contamination from many possible sources is considered, including viable particulate, nonviable particulate, leachable chemicals, and cross contamination with other intermediates or products.
Paths on the Ishikawa diagram used in the case study include the five m’s typically considered for manufacturing processes (i.e., machine, method, measurement, material, manpower/people). A sixth path is included for environment, which is critical to controlling contamination in an aseptic pharmaceutical manufacturing process.
A full contamination risk assessment must consider all categories of contamination, but the case study was limited to the people and environment paths to allow for reasonably detailed analysis given the background materials and time provided. Possible causes of contamination were provided for these two paths, as shown in Figure 3. The other paths were not presented to the workshop participants but are shown here for clarity.
| Impact | Value | Failure Consequence / Impact Assessment Criteria |
|---|---|---|
| High | 5 | Failure of the function can directly lead to:
|
| Medium-High | 4 | Failure of the function can directly lead to:
|
| Medium | 3 | Failure of the function can directly lead to:
|
| Medium-Low | 2 | Failure of the function can directly lead to:
|
| Low | 1 | Failure of the function can directly lead to:
|
| Probability | Value | Probability of Occurence Assessment Criteria |
|---|---|---|
| High | 5 | The design or function is very complex, new, and not well-known, or this failure may be expected on a weekly or more frequent basis |
| Medium-High | 4 | The design or function is fairly complex, new, and less well-known, or this failure may be expected on a monthly or more frequent basis |
| Medium | 3 | The design or function is moderately complex, or this failure may be expected more than once in a year |
| Medium-Low | 2 | The design or function is reasonably standard, reasonably simple, or well-understood (characterized); this failure is expected annually up to five years |
| Low | 1 | The design or function is standard, simple, or well-known; this failure is expected no more often than once every five years |
| Detectability | Value | Probability of Non-Detection Assessment Criteria |
|---|---|---|
| High | 5 | The failure cannot be detected immediately and the failure cannot reliably be detected during regularly scheduled tests (during each batch) prior to release |
| Medium-High | 4 | The failure cannot be detected immediately but may be detected during regularly scheduled testing (during each batch) prior to release |
| Medium | 3 | The failure may be detected immediately but can reliably be detected during regularly scheduled testing (during each batch) prior to release |
| Medium-Low | 2 | The failure will likely be detected immediately and can reliably be detected during regularly scheduled testing (during each batch) prior to release |
| Low | 1 | The failure will be detected immediately |
Workshop teams of four to six people were assigned to either analyze the people or environment path. Each team considered the provided list of contamination causes from the associated path and then chose one or more causes for which they would analyze the associated risk.
FMECA
Although the Ishikawa diagram is a powerful tool in identifying causes for contamination, it treats all causes equally and does not assess the differences in risk between the causes. For true risk analysis, the causes identified with the Ishikawa diagram can then be used to feed a failure-driven risk assessment tool.
| Fishbone | Scenario Information | Risk Assessment | Results | ||||||||
|---|---|---|---|---|---|---|---|---|---|---|---|
| Fishbone Rib | Fishbone Cause | Contamination Failure Mode | Extrinsic Contamination Type | Safeguards | Impact | Probability of Occurrence | Probability of Non-Detection | RPN | Risk Level | Recommend - ations | Justification or Notes |
| Environment | Incorrect differential pressure between production areas | Door propped open | - Cross-contamination - Viable particulate contamination - Non-viable particulate contamination | Door interlocks - Operator training - Alarms - SOP control for process stoppage | 5 | 3 | 2 | 30 | Medium | Install more robust or redundant door sensor with lower delay for trigger | Ensure immediate detection with additional control |
FMECA is a well-established and recognized technique already commonly used in the pharmaceutical industry for risk assessment. FMECA documents the effects of each failure mode and assesses the criticality of each failure scenario through a risk scoring system. Each scenario is scored in three categories:
- Impact: How severe is the consequence of the contamination event on the patient that receives contaminated product?
- Probability of occurrence: Given the safeguards credited as being in place, how likely is the contamination event to occur?
- Probability of non-detection: Can a contamination event be detected, and if so, how quickly?
FMECA scoring criteria can differ between organizations. For the workshop, a proven scoring system based on a 1–5 scale for each category was chosen (see Table 1 for details). This scoring system has been used by the workshop facilitators for risk assessments of many pharmaceutical facilities. One category that may be initially confusing is the probability of non-detection. Because there is an inverse relationship—where higher detectability of a contamination event is associated with a lower risk—for scoring purposes ,the direct relationship between non-detection and risk is considered instead.
The criteria used by the workshop participants includes FDA regulatory consequences, as this workshop was based in the US. However, the impact criteria can easily be adapted to EU, national, or international regulatory consequences for use outside the US.
The workshop teams were given Ishikawa diagram causes to use as a starting point, but, by design, the causes were not overly detailed. The teams were encouraged to develop more specific contamination-failure-mode scenarios around their selected causes. In an example scenario shown in Table 2, a team started with incorrect differential pressure between production areas as the cause and then considered a door propped open as a failure mode for the FMECA.
For each scenario, teams were instructed to identify any safeguards that either prevent or mitigate contamination. Teams later shared their recommendations with the other workshop participants. However, no critique was made during the workshop on the effectiveness or feasibility of the recommendations given by the teams.
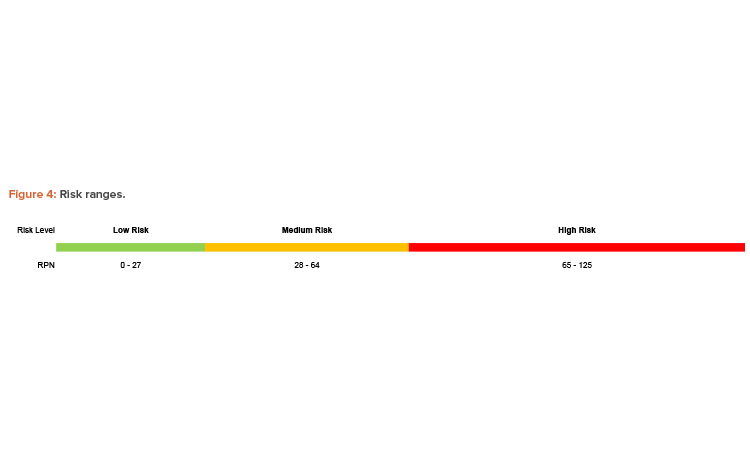
After fully detailing a contamination scenario and identifying safeguards, teams evaluated the risk associated with their scenarios based on the scoring criteria from Table 1. Scores for impact, probability of occurrence, and probability of non-detection are multiplied together to calculate a risk priority number (RPN). The RPN can be used to categorize contamination scenarios based on risk and prioritize recommendations for reducing risk. The RPN scale used in the workshop provides ranges for low, medium, and high risk levels, as shown in Figure 4.
The need for recommendations to reduce risk is based on the RPN and the associated risk level. Low-level risks were deemed acceptable without additional risk reduction; medium and high-level risks required the teams to consider a strategy for risk mitigation. Appropriate risk mitigation may include administrative controls, such as verification of a procedure by a second individual, or engineering controls, such as the recommended redundant door sensors from the example in Figure 4. Each team was given an hour to identify and evaluate their chosen risk scenarios using the described FMECA methodology.
KEY DATA SUMMARY
The 11 teams participating in the workshop were assigned arbitrarily based on table number to analyze either the people or environment Ishikawa diagram path. Six teams considered the environment path and four teams considered the people path, with one additional team choosing to analyze both. Although teams were guided by the Causes of contamination, the causes were left open-ended so that the teams could create specific process and facility failure mode scenarios to analyze. Major areas of focus for the teams included:
- Crossing of clean and dirty flow paths for equipment and personnel
- Gowning procedures and changes in gowning when moving between rooms
- Shared heating, ventilation, and air conditioning (HVAC) between production suites
- Intermittent environmental monitoring frequency
- Air classification grade transitions between rooms
- Sharing of airlocks between production suites
- Room pressurization schemes
- Control of doors between rooms
- General HVAC and power failures
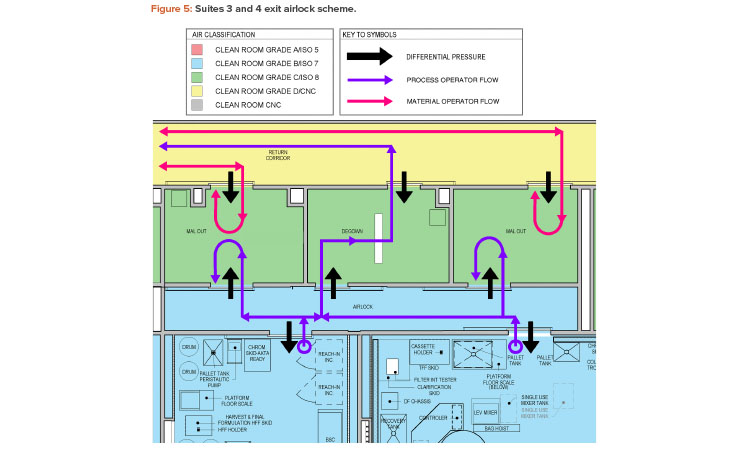
In looking for common themes among the identified contamination failure modes, a repeated area of focus was on the exit airlocks of the production suites. This includes both material airlock and personnel airlock transitions. Figure 5 shows an exit airlock scheme with a shared Grade B to Grade C airlock between production suites 3 and 4.
The design of this exit airlock area was considered to create an elevated risk by several of the teams. From an environmental standpoint, one team evaluated the risk of transfer of aerosolized material between the suites (cross contamination) as medium risk. Similarly, another team considered the risk of transfer of viable and nonviable particulate between material operators and process operators via the material airlock as a medium risk. Suggested remediations included adjusting the pressurization scheme to make the Grade C airlocks a bubble and the Grade B airlocks a sink and increasing the classification of the return corridor to Grade C.
The exit airlock personnel flow was also considered as an elevated risk by the teams. One team noted the possibility of a process operator fully entering a Grade C material airlock from the Grade B clean room to drop off samples and then returning to the Grade B clean room without any change in gowning. This situation, evaluated as a medium risk, could result in viable and nonviable particulate contamination. Another team noted that the material operator faces a similar situation where no change in gowning occurs upon moving between different grades. However, this team considered this to be a very high risk.
Possible remediations identified by the teams are the addition of exit signs and door interlocks to prevent reverse flow into clean rooms, as well as over gowning. Another team noted the possibility of operators from the two manufacturing suites (suites 3 and 4) comingling in the exit interlock and possibly entering a different suite from which they left without any gowning change. Although this was considered a low risk given administrative controls, door interlocks with suite-specific access groups were recommended.
RESULTS
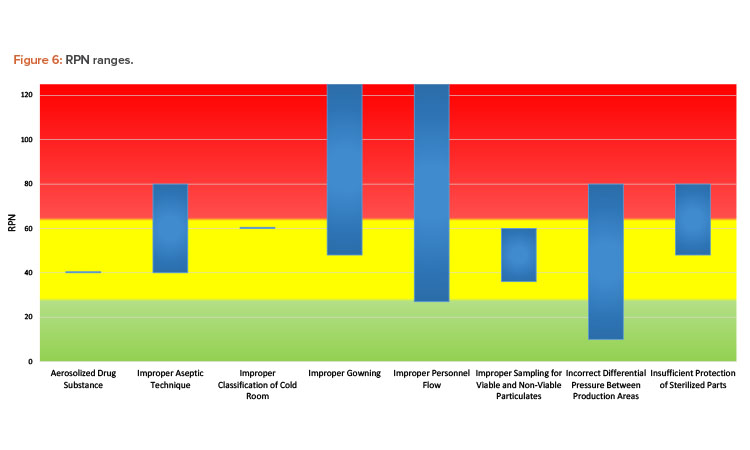
The bar chart in Figure 6 depicts the ranges of RPN scoring based on the cause. Although some causes are represented by a single scenario from one team, and therefore appear as a horizontal line on the chart, most were analyzed by more than one team. As evident from the chart, the same cause may have a range of risk associated with it. Ultimately, the assessed risk value and associated level depends on many factors, such as:
- Assessment team makeup, experience, and biases
- Assessment team expertise on understanding the impact of contamination on the substance or product
- Assumptions made at the time of the risk assessment
- Assessment team understanding and agreement on assessment criteria
- Level of granularity in defining failure modes
These factors almost certainly played a role in the results generated by the workshop teams. After reviewing the case study materials, some teams with experienced members pointed out what they considered to be facility design flaws to the facilitators. Other teams needed assistance to understand the materials provided. Some teams were more liberal with assumptions around functioning safeguards that may be in place at the facility, whereas others assumed the opposite. For example, one team assumed that HVAC air handlers would be shared between the production suites, which is not common in the experience of the workshop facilitators.
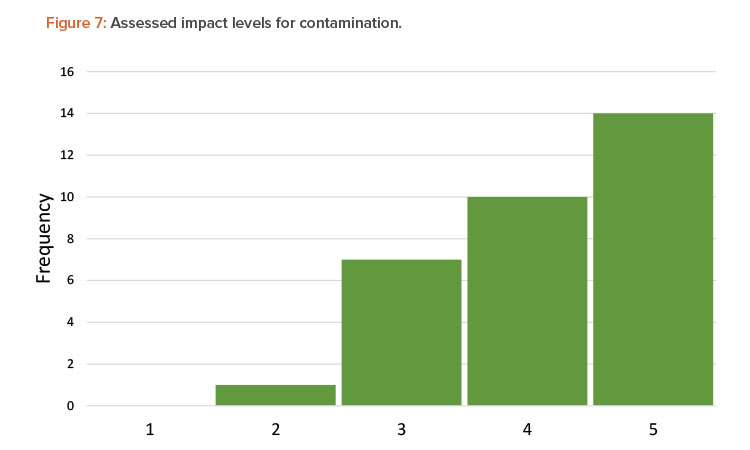
Another factor that affected the range of scoring was a team’s perception of impact or severity of contamination. Although each team was presented with the same process and the same definitions for severity of a contamination event, the teams judged the severity of contamination differently. Figure 7 shows the distribution of severity for all contamination scenarios assessed by the teams.
In over 75% of the assessed scenarios, teams recognized the impact of a viral vector contamination event as being either high or medium high, corresponding to a negative health effect to a patient. However, the remainder of the assessed scenarios fall in the medium- or low-impact range, corresponding to an inspection finding but no impact to a patient. In a real-world situation, other sources of variability may come into play as well, including:
- Methodology used for the risk assessment (FMECA, what-if, fault tree, etc.)
- Scoring system chosen for the risk assessment
- Design and operational information available at the time of the risk assessment
CONCLUSION
Data analysis is the foundation of a successful CCS effort. The vast amount of data to be analyzed includes both intrinsic- and extrinsic-focused information: protocols, standard operating procedures, environmental monitoring data, facility design requirements, and CAPA information. When initiating any risk-based analysis, it is important to identify and manage biases, realizing that there can be very diverse perspectives within a team of individuals from different backgrounds—such as manufacturing, quality, or engineering—and different levels of expertise.
Subjectivity can have a significant impact on the outcome of any risk-based assessment. An overreliance on participant experience or a focus on “rules of thumb” can introduce a bias into the process. It is also important to minimize favoritism to a particular technology or methodology when assessing data. To minimize the impact of this type of subjectivity in the development of a CCS, it is important to use a systematic and objective approach to risk, addressing both intrinsic and extrinsic contamination sources and properly analyzing the data.
The results of the workshop supported the need to mitigate subjectivity using a systemic and objective approach to data assessment. Teams performed a review of the same data set. Each made a series of assumptions based on their understanding of the information and accounted for uncertainties and variability in how they viewed risk. They documented their decision-making process and, through “spirited debate,” challenged each risk element and made conclusions on the level of risk they deemed aligned with the data.
The complete elimination of subjectivity may not always be feasible. The goal is to manage and mitigate its influence as much as possible while reaching a robust strategy for controlling contamination events.


