Air Speed Qualification: At Working Position or Working Level?

The new European Commission GMP Annex 1 “Manufacture of Sterile Medicinal Products” and the equivalent Annex 2 from the World Health Organization (WHO) triggered a discussion in ISPE’s Germany/Austria/Switzerland (D/A/CH) Aseptic Processing Community of Practice (CoP) Steering Committee about where to qualify air speed: “at working position” versus “at working level.” This article provides background knowledge from literature and data from experiments to enhance the discussion.
Regulatory Background and Cleanroom Air Velocity
In 2015, the authors of the Concept Paper on Revision of Annex 1 decided to harmonize the regulatory framework globally, including established methodologies such as those from the International Organization for Standardization (ISO).1 The European Commission (EC), the Pharmaceutical Inspection Convention/Pharmaceutical Inspection Co-Operation Scheme (PIC/S), and the WHO agreed to develop one common updated “Annex 1” for the manufacturing of sterile medicines.
After a long drafting and harmonization phase, the EC published their new GMP Annex 12 in August 2022. This was followed in September 2022 by the publication of the PIC/S’s identical Annex 1.3 Lastly, the WHO published the new guideline under their framework in January 2023 as Annex 2.4 Unfortunately, in the WHO version, a couple of words are different from the EU and PIC/S Annex 1 versions, i.e., “working position” versus “working level” in chapter 4.30.
The setpoint for “proper” air velocity in cleanroom systems is documented in standards and regulations as 0.45 meters per second, plus or minus 20%, which is from 0.36 m/s up to 0.54 m/s. The initial determination tracks back to Willis Whitfield, a cleanroom pioneer at Sandia National Laboratories.5, 6 From his research, the 0.45 m/s recommendation made its way into the US Food and Drug Administration (FDA)’s “Sterile Drug Products Produced by Aseptic Processing—Current Good Manufacturing Practice”7 and into the EC GMP Annex 1 “Manufacture of Sterile Medicinal Products” in 2003.8
When an air velocity of 0.45 m/s for cleanroom settings became a guidance value in many standards and regulations, this started a discussion about where to measure it. In a 2009 Pharmaceutical Engineering® magazine article, Mason, McGarvey, and Spearman reported air speed measurements and air flow patterns in conventional cleanrooms with obstacles in the room, which caused obstruction of the unidirectional air flow.9 The authors of the article used a thermal anemometer and analyzed air velocity changes in environments with these obstacles, then concluded that air velocity measurements should take place close to a high-efficiency particulate air (HEPA) filter face for better reliability and repeatability.9
In 2015, the FDA published a guidance manual10 that provided questions for inspections, including:
- Is the air flow in critical areas unidirectional when delivered to the point of use?
- At what velocity?
- Is velocity determined at the critical work height and at the filter face?
The preceding questions do not refer to a specific air velocity, but only to perform measurements at these two locations. But it is likely that interpretations in practice refer to footnote 5 from FDA Aseptic Guidance 2004:7 “A velocity of 0.45 meters/second has generally been established, with a range of plus or minus 20 percent around the setpoint.”
Experiment Setup
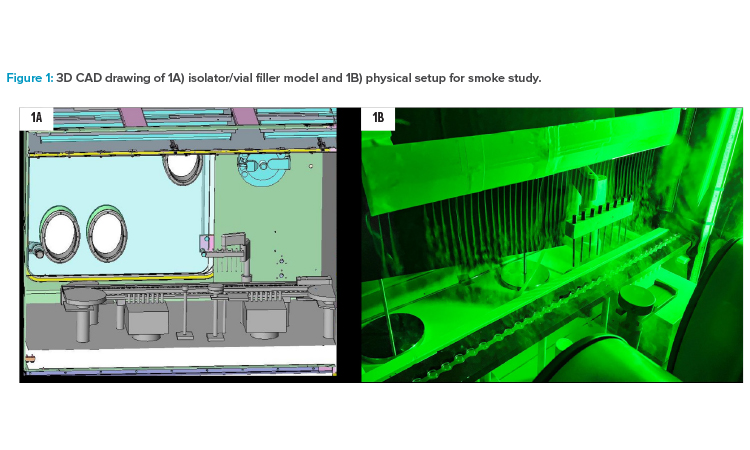
A wooden model of a vial filler/stoppering machine (Syntegon ALF 5080) in a real stainless steel straight double-wall isolator was used as the basis for the simulation as well as for the smoke studies and air velocity measurements. Some compromises had to be accepted because the vial filler model did not perfectly fit into the isolator. By cutting parts at the outfeed of the vial filler model and placing a wooden blind into the isolator to compensate for isolator-specific arrangements, a reasonable adaptation to the air flow properties of the “real vial filler in its own isolator” could be achieved. Figure 1 depicts a computer-aided design (CAD) drawing of the isolator with a vial filler model inside and a photograph of the physical setup for air flow visualization by smoke study.
The focus in all experiments was placed on the core filling section: particle counter, active microbial air sampler, fill needle bar with actuator, and transport system, including tare and gross weighing scales. The wooden model comes with some shape simplifications, but the main geometries were identical to the real machine parts, only less detailed. The wooden model used in this study represents a “worst case” scenario for air flow, because the wooden parts are a bit more robust in the contours and have no aerodynamic openings compared with real parts made from stainless steel.
The isolator was built in 2008. The internal volume is approximately 10 m3. The heating, ventilation, and air conditioning (HVAC) system is capable of conditioning up to 3.850 m3 of fresh air per hour. An air pattern deviation from typical installations could not be avoided: In the isolator applied for this study, a bold frame mount for the textile air diffuser with an outdated design was installed, which caused a slipstream drag reaching down to the open containers. This can be seen in almost all graphics, but it is located at the left side (infeed side) of the fill station and does not interfere with the air flow situation and the measurement in fill cell core.
The air speeds were set and controlled at the measurement point according to Annex B.2 of ISO Standard 14644-3: 150 mm below the textile air diffuser.11 The investigations were focused on one of the most critical positions for the quality of the products in aseptic manufacturing: point of fill with open containers and openly exposed drug product.
Simulation Setup
The simulation was conducted using OpenFOAM 5.x, a free and open-source computational fluid dynamics (CFD) software package. The simpleFoam solver was used for solving the Reynolds-averaged Navier–Stokes (RANS) equations for a stationary, incompressible flow. The mesh was generated using the hexdominant method with the preprocessing tool SnappyHexMesh. This method involves creating a structured mesh with hexahedral cells that conform to the geometry of the object being simulated. The boundary cell size was set to 2.5 mm to ensure a sufficiently fine mesh near the walls and other areas of interest.
Solver
The simpleFoam solver is capable of simulating both laminar and turbulent flows. For turbulent flows, models such as the k-epsilon or k-omega shear stress transport (SST) models are used to account for the effects of turbulence on the flow. In this simulation, the k-omega SST turbulence model was used. This model considers the effects of both laminar and turbulent flows. And it can provide a more accurate prediction of the turbulent flow structure compared with the k-epsilon model. The model consists of two equations: one for the kinetic energy (k) and one for the specific dissipation rate (omega). These equations are augmented with the RANS equations to account for the effects of turbulence on the flow. The model also uses a wall function to model the turbulent layer near the wall.
The setpoint for “proper” air velocity in cleanroom systems is documented in standards and regulations as 0.45 meters per second, plus or minus 20%.
SIMPLE Algorithm
The Semi-Implicit Method for Pressure Linked Equations (SIMPLE) algorithm is a widely used algorithm for solving the Navier–Stokes equations for incompressible flows.
The algorithm consists of the following steps:
- Initialization: The pressure and velocity are initialized on a coarse mesh.
- Pressure calculation: The pressure is calculated using the pressure Poisson equation.
- Pressure correction: The corrected pressure is updated using the continuity equation.
- Velocity correction: The velocity is updated using the corrected pressure and the Navier–Stokes equations.
- Convergence check: The error is calculated and compared to a specified tolerance level. If the tolerance level is reached, the algorithm stops. Otherwise, the algorithm proceeds to step 2. Visualization of flow velocity, turbulent kinetic energy, and streamlines use Paraview 5.11.0.
Two velocity components, Umag and Uy, are visualized using the slice function to cut through the domain and show the velocity distribution on a 2D plane. In the simulation, 13 different air speeds were computed (0.1 m/s to 1.0 m/s in steps of 0.1 m/s; plus 0.36 m/s, 0.45 m/s, and 0.54 m/s), from which five were shown in this article: 0.20 m/s, 0.36 m/s, 0.45 m/s, 0.54 m/s and 0.90 m/s.
The turbulent volume-specific energy k (as a representative for turbulence) is visualized by isometric projection with k = ½ × (u’)2 = 0.0004 J/m3. This value was chosen to display turbulence effects over the complete range of air velocities: from 0.2 m/s up to 0.9 m/s. The variable u’ represents the average scalar velocity.
Air Velocity Measurement
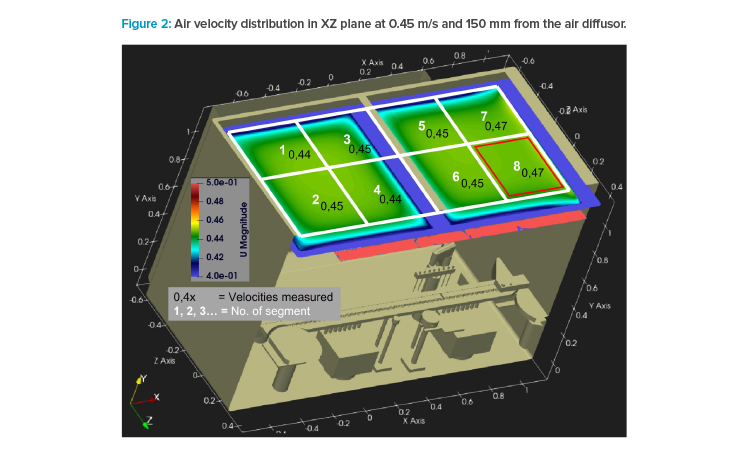
All air velocity measurements were performed with a calibrated impeller anemometer (model Testo 480) equipped with a 100-mm-diameter wheel. This wheel was placed in a horizontal position to measure the Y vector only. The sterile air diffuser in the test isolator was segmented into eight areas. To show the air distribution for each adjusted air velocity in XZ area (horizontally), the wheel was positioned in the center of these eight areas, 150 mm below the sterile air diffuser (see Figure 2).
For vertical air velocity mapping, the anemometer was placed in the center of area 8, which was located to the right (outfeed) of the fill core at four different levels: 150 mm from entry plane, 300 mm from entry plane (both in the ISO range), 20 mm above 10R vial opening (which is 900 mm from entry plane), and 200 mm above vial opening (which is at the height of the fill needle bar in “at rest” position—or 770 mm from entry plane). Vertical air velocity measurement could not be performed at area 6 (fill needle bar area) due to interfering contours or at area 5 (area with static hot-wire anemometer) due to accessibility.
For air velocity measurements and the smoke study, the set of variations was limited on the high-speed side due to the fan power maximum (0.91 m/s at area 8) and was limited on the low-speed sector due to the lower sensitivity limits of the impeller anemometer. It was decided to take 0.2 m/s as the lowest air velocity, where the anemometer still worked precisely. As a result, a set of five speeds was applied: 0.2 m/s, 0.36 m/s, 0.45 m/s, 0.54 m/s, and 0.91 m/s.
Air Flow Visualization Studies
For air flow visualization, a smoke generator (type Antari MB-1) with Safex fogging fluid Extra Clean F&D (art. no. 20302005) was used together with a 20-liter aerosol buffer and a distribution lance of Syntegon-owned wing design. The smoke was transported by compressed air to the nozzles of the lance. The air pressure was adjusted to the air speed inside the isolator by maximizing the length of the smoke filaments.
The pictures were taken with long shutter times (1/10 to 1/25 of a second) to catch the flow of smoke and direction. Limits at high air speeds came from low smoke density—higher air flow volumes in the isolator correspond to higher dilution factors. The aerosol concentration in the “smoke filaments” could not be increased further because condensation occurred and blocked the filament nozzles.
The illumination was provided from the opposite side of the camera position by a green LED light tube. For optimizing the photographic situation (i.e., maximizing the contrast of smoke against background), dark panels were used, which were optimized to not have a significant effect on the air flow (i.e., by shielding air flow from return air duct openings).
Results
In the simulation, the air speed distribution at height level according to Annex B.2 of ISO 14644-311 was computed 150 mm below the textile air diffuser. The result of homogeneity for 0.45 m/s (setpoint) is shown in Figure 2—the scale ranges from 0.40 to 0.50 m/s to show even minor differences. The air velocity variations are very small: 0.44 to 0.47 m/s across the isolator area.
In Figure 2, an overlay with a grid of eight fields is also shown, whose centers were used for air velocity measurement with impeller anemometer. The measurement results are also written in values in the graphics. A good match between simulation and measurement can be seen. Both experiments indicate slightly higher air speeds to the right side (outfeed) of the isolator.
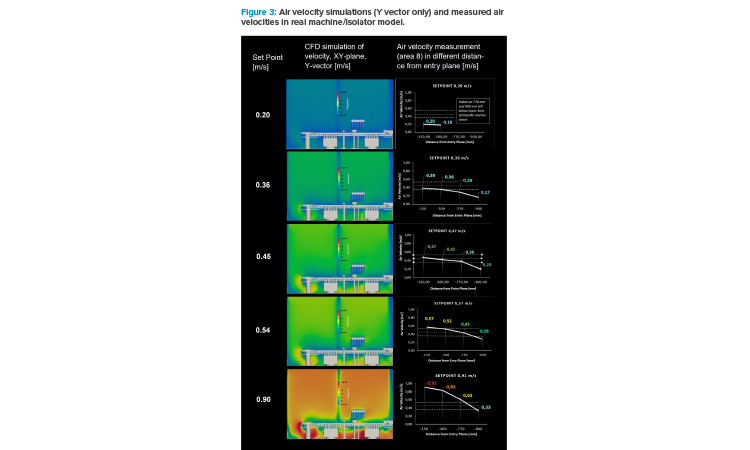
In Figure 3, a set of velocity simulation pictures and the results of the air velocity measurement in the real isolator are presented. The scale for air velocity is ranging from 0 m/s (dark blue) to 1.25 m/s (dark red).
The simulation graphs show the front view of the model (XY plane) and display the air velocities in Y direction only (Y vector). This represents the idea of unidirectional air flow (UDAF) as it is embedded in Annex 1: the air should come from the top—low in turbulence—and swipe over the open container and carry airborne or surface-bound particles into the filters (via return air ducts), if present and removable via an air flow. The filters or openings of the return air ducts should be placed below the product because gravity should play against particles, whose trajectories are directing back.
A gradient of air velocity from the top to the bottom can be recognized for all air speed setpoints equal to or higher than 0.2 m/s. Air flow hitting a surface must go around the interfering contour, which means that the air velocity vector in orthonormal direction is at zero at the surface. The other vectors perpendicular to the impact direction will show high speed to get around the object. This principle is well known, i.e., from automotive streamline design or wing design for aircrafts.
Depending on the shape of the interfering object and the velocity of the UDAF, macroscopic eddies might be created, which take the air and residual particles, from the surface and bring them back above the objects, which results in an increased likeliness of particles being deposited into an open product container. This should be avoided.
Figure 3 clearly shows that even at the highest air velocity setpoint (0.9 m/s), the air velocity at vial height (20 mm above 10R vial opening) does not reach 0.36 m/s. Whether representing the “working height” for air speed measurement in the draft version of the new Annex 1 (2020)12 or the “working level” in Annex 2 from WHO (2023),4 the lower limit for recommended air velocity (guidance value) is not met.
This means that the speed setpoint needs to be more than doubled to achieve 0.36 m/s at 20 mm above vial opening. Much more turbulence was generated after taking the setpoint of air velocity from 0.45 to 0.90 m/s. At the 0.45 m/s setpoint, the air velocity in Y direction right above the open vials has not been more than 0.2 m/s. At a setpoint of 0.36 m/s (150 mm from entry plane), the air velocity at the vial opening dropped below the lower limits of the impeller anemometer: at roundabout 0.17 m/s.
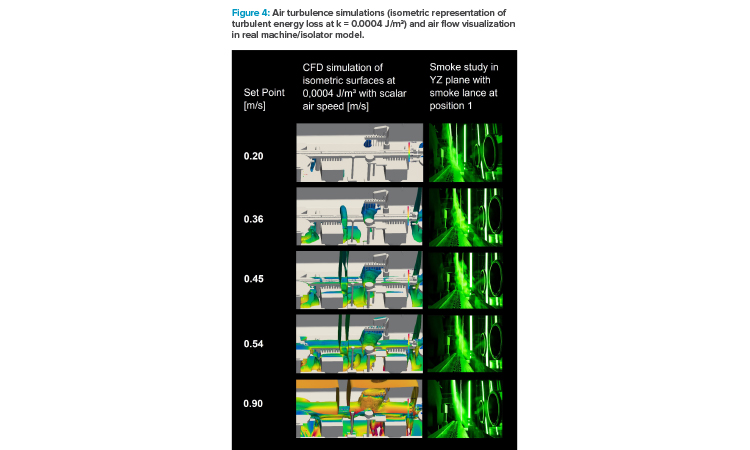
Figure 4 represents turbulence level at different air velocity setpoints by displaying the isometric projection of a turbulent energy loss at k = 0.0004 J/m3. The color code represents the air speeds (scalar values) at these isometric surfaces in a range from 0 to 1.25 m/s. As a comparison, pictures of the smoke study at those air velocity setpoints are depicted in the graph.
With rising air velocity, the totalized area of turbulent energy loss increased significantly and air speeds at these areas got higher. A critical situation might come with the turbulence getting more voluminous (i.e., below the fill needle holding bar) and migrating from below the transport system/below vial level to “at” transport system or even above.
The series of smoke test photographs at different air velocity setpoints in Figure 4 reveal the air flow design inside of the isolator. The smoke lance was placed right above the fill needle bar: at 0.2 m/s setpoint, smoke filaments touched the transport system and swept over the open containers. While increasing airspeed, cross flow directly to the return air openings was generated, with little or no air touching the row of vials (at 0.90 m/s).
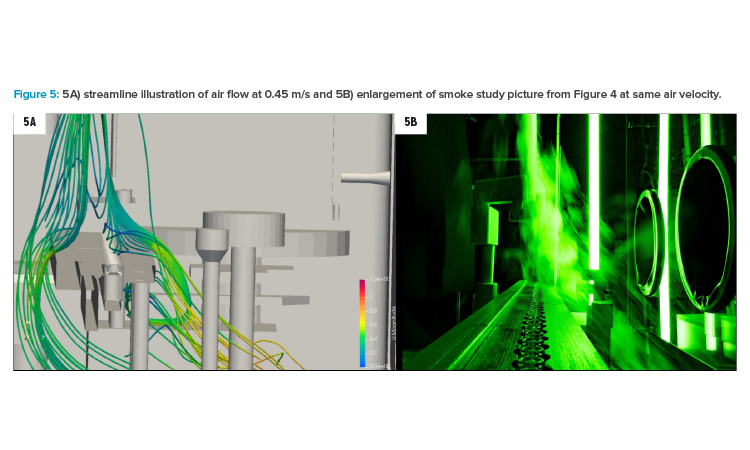
Figure 5A shows the situation at 0.45 m/s with streamlines coming from the smoke lance, which was relocated slightly behind the fill needle bar (compared to position in Figure 4 with location right above fill needle bar). Firstly, this illustration reveals the air flow hitting the vial transport and going around this barrier. Secondly, the air velocity close to the open containers was lower than 0.36 m/s (shown in the color code in the legend). Last, but not least, in Figure 5A, an eddy is visible on the outfeed star wheel (in the background on the right side of the transport). Considering that the wooden model represented a worst-case scenario, this situation in grade A areas should be avoided if possible. At 0.45 m/s, the simulation (5A) showed that the eddy stayed well below transport level.
Conclusion
The results show that the location of the air velocity sensor has a significant impact on air flow dynamics, especially in combination with the air flow value requirement of 0.45 m/s +/- 20% specified in Annex 1 (EC GMP2 and PIC/S 3) and Annex 2 (WHO4). The air velocity decreases from the top of the cleanroom (restricted access barrier systems [RABS] or isolator) to the bottom/machine plate (see Figure 3).
This study was performed with a straight wall isolator. Results may differ with inclined window barrier systems, because of smaller airflow column cross section of return air duct openings compared with cross section at air entry plane. But the major principles stay the same and the general conclusion applies also to this type of isolator or RABS design. If the “working level” discussed in Annex 2 (WHO4) means at height level of filling operation (represented in this publication by a level 20 mm above 10R vial opening), the air velocity setpoint must be higher than 1.0 m/s at the level set by ISO Standard 14644-311] to achieve the required air velocity at point of fill. The higher air volumes would then need to be conditioned and recirculated, and the air flow design adjusted to minimize crossflow.
And finally, it would also create turbulence in the grade A zone. In the setup represented in this article, at higher velocity setpoints (i.e., 0.90 m/s), the turbulence occurred below the fill needle holder, on the transport system, and near isokinetic probes and viable samplers (see Figure 4). The unidirectionality of air flow at lower velocity setpoints was much better. At lower velocities, air flow can still carry particles away from open containers, without risking turbulence or even macroscopic eddies in the fill environment, as shown in Figure 5. This is also in accordance with the findings of Ma-son, McGarvey, and Spearman9 and the results from earlier studies cited by Brande, Milholland, and Haycocks.6
Paragraph 4.30 of the new Annex 1 (EC GMP2 and PIC-S3) requires: “Air speed should be designed, measured and maintained to ensure that appropriate unidirectional air movement provides protection of the product and open components at the working position (e.g., where high-risk operations occur and where product and/or components are exposed).” The wording “at the working position” can be interpreted as “at working level” and/or where working (processing) take place, i.e., at the filler station or at the stoppering station.
When an air velocity of 0.45 m/s for cleanroom settings became a guidance value in many standards and regulations, this started a discussion about where to measure it.
In the draft version of the Annex 1 from 2020,12 it was proposed under paragraph 4.32: “Air speed should be designed, measured and maintained to ensure that appropriate unidirectional air movement provides protection of the product and open components at the working height (e.g., where high-risk operations occur and where product and/or components are exposed).” By changing “working height” from the draft version of the new Annex 1 from 2020 to “working position” in the final document,2 the EMA working group on Annex 1 indicated that they clearly did not mean the height level as “working position,” but rather the location on the machine where quality-critical processes are located.
Measurement at ISO level (“150 mm to 300 mm from the entry plane”) and compliance with regulatory air velocity corridor at this level has even more advantages: It guarantees reproducible measurement, because handling and machine movements do not interfere with the direct environment of the air velocity sensor that is creating measurement deviations. Sensors at this height level are less at risk to be damaged during manual glove interventions. And finally, the CO2 footprint of the cleanroom enclosure operation is much lower because lower air volumes will be conditioned and recirculated at lower speeds.
The authors propose staying with the air velocity setpoint according to the new Annex 1, specifically, “at working position,” which means where quality-critical processes take place, i.e., filling or stoppering. But air velocity (0.45 m/s +/- 20%) should be measured and controlled at the level specified by ISO Standard 14644-3, which is 150–300 mm from the entry plane. Air flow visualization studies must correlate with Annex 1 to effectively sweep away particles from the air above the open containers and by reducing turbulence in critical areas as much as possible.
Authors
ISPE’s D/A/CH affiliate Aseptic Processing CoP Steering Committee authored this research article.
About the Authors
Acknowledgements
The authors acknowledge Marcus Eichbauer, Ralph Eisenschmid, Thomas Kosian, PhD, Jonas Kuemmerer, Stefan Ruehl, and Nizar Salloum from Syntegon for their experimental work and helpful proposals for the experimental design, results, and interpretation of the subject matter discussed in this article.


