Benefits and Challenges of Process Capability Metrics

Process capability is a fundamental concept for manufacturers. Pharmaceutical, biopharmaceutical, and medical device manufacturers leverage capability analysis along with other statistical quality control (SQC) techniques to enable timely supply of quality medicine to patients.
Process capability is defined in ASTM E2281 as “the natural or inherent behavior of a stable process that is in a state of statistical control.”1 Process capability analyses typically compare process behavior to customer needs. Metrics such as capability and performance indices reflect the ability of a manufacturing process to deliver a product meeting the required specifications.
Capability Analysis in Practice
Although the formulas for capability indices are relatively simple, real-life application can be challenging due to complexities that are not included in simple textbook examples. For instance, statistical control is not necessarily expected when data fail the underlying assumption of a random homogenous distribution, which commonly occurs in pharmaceutical manufacture because of autocorrelation or subpopulations. Approaches for limited data and non-normality must also be considered, as well as the derivation of specifications.
Ultimately, pharmaceutical, biopharmaceutical, and medical device manufacturers use capability analysis along with SQC techniques to supply patients with the right medicine, at the right time, and at the right cost. In addition to the obvious requirement of ongoing product quality, achieving this comprehensive patient goal depends on efficient use of organizational resources. The use of process capability (as one tool among others) to manage product quality risk and prioritize resources has been discussed in previous ISPE publications.
Allison et al. proposed a process capability maturity model that includes a risk-based approach to process capability which “prioritizes and applies resources where they are needed most to enhance patient safety, guarantee compliance, ensure efficient use of resources, and drive business value.”2 The ISPE Process Capability Team describe the role of process capability metrics in process monitoring and product robustness efforts as “most meaningful as a tool to proactively identify risk of out-of-specification results.”3 In this article, we focus on the practical details of this utilization.
We begin with a foundational section including discussion of relevant nuances for the mentioned industries, followed by a practical implementation of process capability metrics for risk assessment enabling appropriate prioritization and control, and end with case studies of real-world utilization of process capability.
Concepts and Definitions
Process Capability Indices
Process capability is commonly described as the ability of a process to deliver a product that meets customer needs. More specifically, it is the comparison of a fixed quality range (specification range) with the manufacturing range (spread of process data). Process capability indices condense this comparison into a single, dimensionless metric generally defined as:
Eq. (1): Process capability index=specification rangespread of process data
These indices can be translated to a quantifiable risk (e.g., percent defective) when underlying statistical assumptions are met. It is easily seen that risk decreases as the index increases. That is, as the relative width of the process variability decreases compared to the specification range, there is less risk of producing a product out-of-specification (OOS) limits.
The exact computation of process capability indices depends on the method used to estimate variability (standard deviation) and whether data centrality with respect to specification limits is incorporated. The following section describes commonly used process capability indices in the pharmaceutical, biopharmaceutical, and medical devices industries.
Process Capability Indices Pp, Ppk, Cp, and Cpk
Process capability can reflect short-term or long-term expectations. The computation of process variability distinguishes the two, not the sample size or referenced time. Long-term estimates of process capability use the sample standard deviation to estimate process variability, symbolized by ˆσLT. The long-term index, Pp, is the ratio of the specified fixed quality range—difference between the upper specification limit (USL) and lower specification limit (LSL)—and the spread of the process data (6ˆσLT). It quantifies the potential of process output to fall within a specified range.
Eq. (2):Pp=USL−LSL6ˆσLT
where ˆσLT=√∑ni=1(xi−ˉx)2n−1
The long-term index Ppk takes into account the location of the data and quantifies process performance with respect to the nearest specification.
Eq. (3):Ppk=minimum{USL−x3ˆσLT,x−LSL3ˆσLT}
Short-term process capability is estimated by replacing ˆσLT in equations (2) and (3) with a short-term estimate of variability, derived from the moving range between consecutive results when individual results are trended. The short-term indices, Cp and Cpk, are thus computed as:
Eq. (4):Cp=USL−LSL6ˆσST
Eq. (5):Cpk=minimum{USL−ˉx3ˆσST,ˉx−LSL3ˆσST}
Cpk represents the capability if the long-term shifts in the process were removed. More detail on the concepts and computation of capability indices can be found in Montgomery4 and Wheeler.5
Difference Between Long-Term and Short-Term Sigma
If a process is stable and homogenous (data can be described by single distribution) then long-term (ˆσLT) and short-term (ˆσST) sigma/standard deviation will be equivalent. However, if data are not homogenous, these two estimates can be quite different. Non-homogeneity could result from mean shifts with known cause (e.g., production campaign influences, bulk quality control [QC]analysis, or different raw material suppliers) or autoregressive effects (e.g., equipment wear and seasonal drifts). If these issues are cause for concern during manufacturing, and identification of small shifts or drifts is sought, then use of short-term deviation (ˆσST) is appropriate for both control charting and process capability estimation, and Cp and Cpk should be applied.
On the other hand, if the non-homogeneity or detectable patterns or trends are expected as an intrinsic part of the process, use of long-term standard deviation (ˆσLT) estimate is likely more appropriate. Not only will Pp and Ppk represent the actual performance given all the observed variation in the process, but this choice will also result in more suitable long-term control limits. Non-homogeneity is quite common in pharmaceutical and device manufacturing due to multiple restrictions within process improvement, including, but not limited to, limitations to control raw material quality, complicated supply chains, complex manufacturing and analytical processes, batch campaigns, and regulatory constraints and efforts. Thus, performance indicator Pp or Ppk is generally appropriate.
| Cpk or Ppk | OOS Risk (One-Sided)*, % |
|---|---|
| 0 | 50.00 |
| 0.5 | 6.68 |
| 0.6 | 3.59 |
| 0.7 | 1.79 |
| 0.8 | 0.82 |
| 0.9 | 0.347 |
| 1 | 0.135 |
| 1.1 | 0.0483 |
| 1.2 | 0.0159 |
| 1.33 | 0.0032 |
| 1.5 | 0.00034 |
| 2 | 0.0000001 |
*Note this risk is one-sided. For a rough estimation of two-sided risk, multiply the OOS risk
by a factor of 2.
Knowledge of actual performance is of primary importance when using process capability metrics to assess risk and prioritize resources, compared to the potential process capability that could be possible if shifts and trends that occur over the longer term were removed. Consider an analogy in the sports world. A team may have the greatest potential on paper based on individual player statistics but it’s their overall performance that really matters. And if this performance is inadequate, then further study to understand the gap between potential and actual performance is warranted.
Failure Rate Prediction
Capability indices can be directly translated to the OOS risk listed in Table 1 if certain statistical assumptions are met, specifically normality and independent and identically distributed (IID) data.
If these assumptions are not met, the estimated OOS risk/defective rates in Table 1 will not be accurate. However, if indices are primarily leveraged to assess risk with commensurate action, this inaccuracy may be tolerable. If the reason for failure to meet assumptions cannot be identified or is due to the intrinsic nature of the parameter (e.g., campaign effect, autocorrelation due to bulk testing or raw material usage, bounded data, etc.), subject matter experts (SMEs) must determine the risk prediction qualitatively, which is further discussed next.
Influence of Derivation of Specification Limits
In typical industrial applications, specification limits are directly based on customer needs. Because the in vivo mode of action cannot always be translated to simple numerical ranges, this is often not possible, particularly for biopharmaceutical products. Also, it is not common practice, nor is it necessarily feasible or desirable, to design clinical trials to have a range of quality attribute results reflecting expected manufacturing process capability.
| Risk Evaluation Capability Criterion Threshold |
Risk Category (Risk of OOS) |
Additional Risk Evaluation | Management Response |
|---|---|---|---|
| Ppk ≥ 1.33 | Low | None; decrease in monitoring intensity level may be appropriate | Low risk to product, hence no response |
| 1.33 > Ppk ≥ 1.0 | Medium | Further statistical analysis and/or judgment by SMEs may be required to verify or adjust risk category |
Medium to low risk to product, hence no response |
| Ppk < 1.0 | High | Thorough statistical analysis by SME to verify or adjust risk category; detailed investigation may be warranted to determine appropriate risk control |
Aware of the associated risk to product and supply chain; support and provide resources for any investigational and/or remediation activity |
This lack of patient-centric specifications and guidance in ICH Q6B6 leads to the common practice of using the actual process performance from the limited process development and clinical batches to compute acceptance criteria for the product specifications. These acceptance criteria (commonly termed specification limits and used as such in process capability computations and software) are often derived using either a tolerance interval or simple mean +/- 3*standard deviation approach. These approaches can lead to conservative (narrow) limits and limit the Ppk to a value of 1 (a 3-sigma process).
Additionally, this approach can have serious consequences, as natural deviations in manufacturing and analytical measurement that occur in the commercial supply stage are not considered in the initial specification limit estimation process. Additionally, internal release limits (IRL) designed to account for potential change during shelf life of the product will often further reduce the acceptance range. It is critical to understand the effect these two practices have on process performance metrics, and seemingly poor performance of the pharmaceutical industry compared to other industries where specification limits are independent of process performance.
Practical Implementation of Process Capability
Ultimately, the primary purpose for capability and performance analysis is ongoing risk assessment and commensurate control aligned with the quality risk management process described in ICH Q9.7 More specifically, process capability metrics are used to analyze the risk to product quality by estimating the likelihood of OOS results. The understanding that the relationship between and likelihood of OOS results is nonlinear is crucial to evaluation of that risk. Table 1 highlights that small changes in for values < 1.0 have a marked effect on the likelihood of OOS results, whereas a negligible increase in expected OOS results occurs for changes when Ppk is greater than 1.33. With this understanding, risk evaluation such as the grid of Table 2 can be properly designed.
It is often reasonable to assign low risk to processes with Ppk values > 1.33, given the expected number of results exceeding specification limits is small (< 0.006%) for values above this threshold. The criteria identifying medium risk and high risk are key, given critical decisions might be made for these levels. These thresholds and related actions are approved by management.
Criteria in addition to the OOS risk could be included to determine the details of each risk category, such as product volume, medical need, supply chain risk, and product cost. For instance, adjustment of the capability criteria in Table 2 to trigger earlier action may be warranted for a high-volume product, or one having critical patient need. Further details of this table are provided in following discussions.
Typical Process Capability Application Process in Pharmaceutical Industry
Once the variables to be monitored have been identified (relevant critical quality attributes [CQAs], in-process checks, critical process parameters, and critical material attributes), and management has defined thresholds and actions for each risk category, process capability can be leveraged in a risk assessment of process performance. Before process capability is computed, potential influences of the data must be accounted for, such as:
- What is the scope of the data or the data window? Does it use specific dates, such as last quarter or last year, or is it based on a specific count, such as the last 15 batches?
- Has the data been modified, for instance to remove outliers? Is this elimination justified?
- Is the data in meaningful time order, such as manufacturing run order or testing date?
- What is the influence of the measurement system?
- What is the unit level? For instance, is the measurement an individual or average result?
- What data characteristics could influence process capability interpretation?
Once data influences are understood, process capability metrics can be used as a tool for risk assessment of ongoing product quality and hence prioritization of resources. Figure 1 displays this risk assessment and associated actions. This sample flow chart includes statistical decisions related to several common nuances of pharmaceutical manufacturing data.
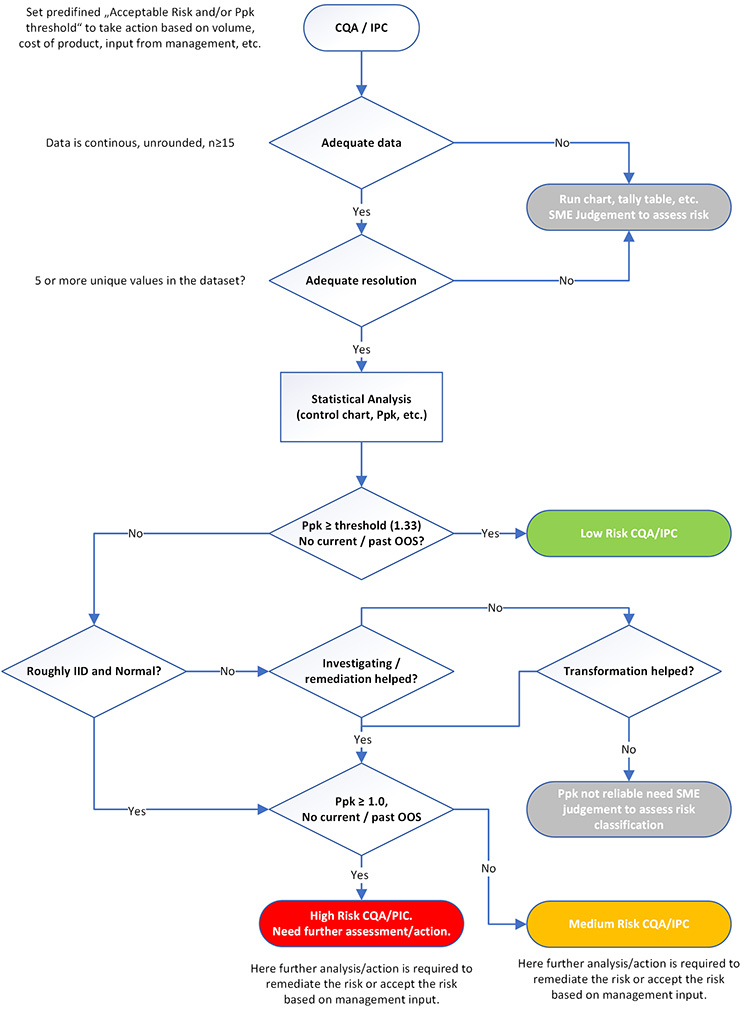
To properly analyze performance risk using process capability metrics, data must meet the following requirements of both sample size and data resolution.
Sample size
There is no magical sample size that is appropriate for every application. It is recognized that Ppk can be unstable until 60 to 90 results have been incorporated. However, this amount of data could take years of production or be completely unfeasible for low-volume products. Thus, to enable a risk-based approach as described in Table 2, Ppk can be computed for data sets as small as 15 data points. However, in such instances, the Ppk values should be considered tentative and the influence of the small sample size on prediction accuracy should be recognized in risk evaluation. If possible, sample size can be increased by extending the historical data window. If this is not plausible, or is unreasonable due to process changes, the performance of a process with limited data can be practically interpreted by an SME with run charts annotated with specifications.
Data resolution
Inadequate data resolution results in increased uncertainty in the estimate of standard deviation.3 A general rule of thumb is that a data set must include at least five unique values, quickly confirmed with a simple dot plot. Whenever possible, it is best practice to evaluate data in raw, unrounded form because rounding can cause low resolution. Like inadequate sample size, run charts annotated with specification limits for practical interpretation by SMEs are recommended for cases of inadequate resolution.
Once adequate data with adequate resolution is available, Ppk can be computed and used in an evaluation of risk using categories such as those in Table 2. More detail for the risk categories and the influence of data assumptions follows.
Low-Risk Attributes
Low-risk attributes with Ppk of 1.33 or higher need no further statistical analysis or action. Resources are better spent on parameters categorized as higher risk, or other more value-added activities. Depending on site governance and the current monitoring practice, reduction in the monitoring level of such low-risk attributes may be warranted.
Medium-Risk and High-Risk Attributes
For medium-risk or high-risk attributes, further analysis (e.g., a control chart, histogram with specifications, and a normal probability plot) should be performed to obtain a more precise understanding of the risk. For attributes in these categories, understanding the influence of the two underlying assumptions of IID data and normality are essential to proper risk evaluation.
IID Data
The control chart can be used to practically evaluate the IID assumption that underlies the translation of Ppk into a risk of OOS. It is not uncommon to observe multiple clusters of data because major sources of variability, such as raw materials, are not experienced randomly. In these cases, the assumption of a single population of independent results is not met, and estimation of a single Ppk value may be unreliable. Automated processes also often exhibit non-independence, evidenced by autocorrelation in control charts. Separating a control chart by stages (a potential factor responsible for a lack of IID, such as campaign, laboratory, raw material, etc.; example is shown in case study 3) may identify the cause for failure of the IID assumption.
Non-Normality
Non-normality also impacts the accuracy of the estimated risk from Ppk values. Visual probability plots are recommended to assess normality instead of reliance on a p value from formal statistical tests such as the Anderson–Darling or Kolmogorov–Smirnov tests. If the assumption of IID is not met, then a normality test is irrelevant. If the data are not normal, several alternatives are possible for estimating risk, including data transformation, fitting an alternative distribution, or using a nonparametric approach.
However, data transformation should be applied only when the reason for non-normality is understood (inherent to the nature of the measurement) and behavior is predictable. Complex transformation procedures, such as the Johnson transformation, are difficult to explain and justify and should be avoided. Non-parametric approaches require large sample sizes to obtain reasonable confidence. When the underlying distribution is not known to be inherently non-normal, often the most reasonable approach is to assess the practical significance of the non-normality. For instance, the Ppk may be so high that the inaccuracy caused by non-normality is inconsequential. Or the skewness that influences the Ppk may be in the opposite direction of the closest specification.
Potential Treatment of Violation of Statistical Assumptions
If potential reasons for the violation of IID data and normality assumptions are identified (e.g., campaign effect), then control charts and process capability should be plotted and estimated appropriately (e.g., plot and estimate control chart and process capability respectively by campaign and scrutinize performance of latest campaigns). However, if potential reasons cannot be identified or failure of IID or normality assumptions is due to the basic nature of the variable (e.g., lower bound in case of impurity), the level of risk is left to the judgment of SMEs. There are several options to evaluate performance in these situations, including:
- Assess the distance of results to specification limits (e.g., actual results more than one standard deviation from the closest specification limit combined with no OOS results in the last three campaigns could reduce the risk category).
- Evaluate recent performance or trend in context of historical performance (e.g., recent campaigns operating closer to specification limits compared to past campaigns could translate to high risk).
- Compare performance after process change to historical performance (e.g., after recent corrective and preventive action [CAPA] implementation, a process that has moved farther from specification could reduce risk category).
- Compare actual performance to that predicted by the normal distribution using the mean and standard deviation of the data (e.g., skewness that results in actual performance better than predicted by the computed normal distribution could reduce the risk category, whereas results closer to the nearest specification than a normal distribution would predict could translate to high risk).
In addition to more rigorous statistical analyses, additional cross-functional investigation is often warranted for high-risk attributes to avoid OOS results. Risk control ranges from increased monitoring frequency to remedial actions to reduce risk.
It is quite common that the underlying assumptions are not met. It is critical to understand that textbook application is not to be expected, requiring interpretation that combines both statistical and process knowledge, along with relevant business and patient influences. To demonstrate real-life application of the flow chart in Figure 1, the next section provides case studies of the practical use of to analyze product quality risk and prioritize resources for common situations of complex, non-textbook-type data.
Case Studies
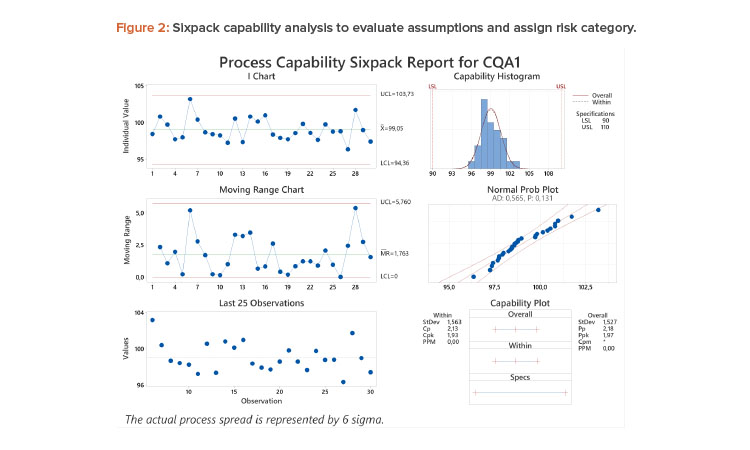
Case Study 1: Stable, Normal Process
A process capability analysis8 of assay results from 30 batches with LSL = 90 and USL = 110 is shown in Figure 2. There is adequate data with acceptable resolution and no notable trend or distribution features. The estimated Ppk of 1.97 is greater than the predetermined threshold of 1.33. According to the flow chart, this attribute can be classified as high performing, representing a low risk of OOS results, and no further analysis is needed.
If specifications of 95%–105% were applied to the same data, the Ppk would decrease to 0.88, and the reliability of the Ppk needs to be considered. Based on the control chart (stable and random), the histogram and normal probability plot, the data adequately meet assumptions of IID and normality. Hence, the estimate of Ppk is reliable and the high-risk category would be assigned.
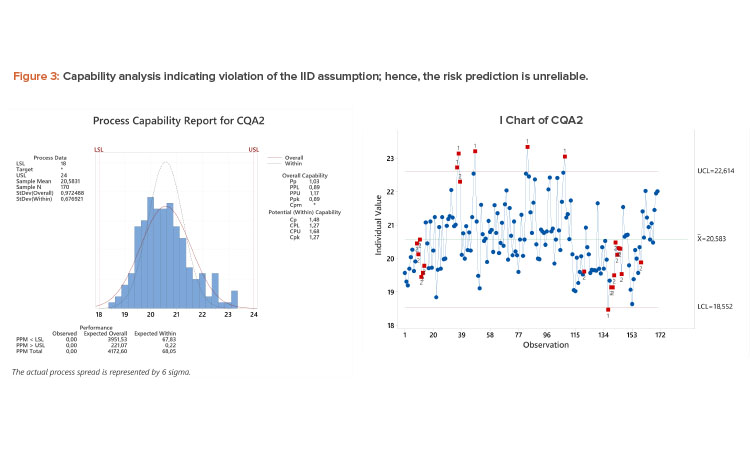
Case Study 2: Autocorrelated Process
Process capability analysis revealed a Ppk of 0.89 (see Figure 3). However, there is evidence of autocorrelation in I-chart (process drifting and/or shifting) that invalidates the IID assumption. The multiple subpopulations inflate the long-term standard deviation, resulting in a deflated Ppk, whereas the short-term estimate derived from the moving range and used to estimate Cpk underestimates the overall variability. Thus, the true capability of the process is somewhere between the Ppk and Cpk values; see the discussion of equations (2)–(5). Note that the overlaid normal distribution using the long-term (overall) standard deviation overestimates the amount of results in the left tail of the distribution.
Although addressing the cause of the subpopulations could lead to increased process capability, this parameter could be classified as medium risk given the distance of the majority of the data to specification, there are no results within 0.5 units of specification (equal to about 0.5 standard deviation), and there were no OOS results in the 170 batches. A detailed investigation is not warranted; risk control actions would be limited to (possibly) increasing the frequency of monitoring.
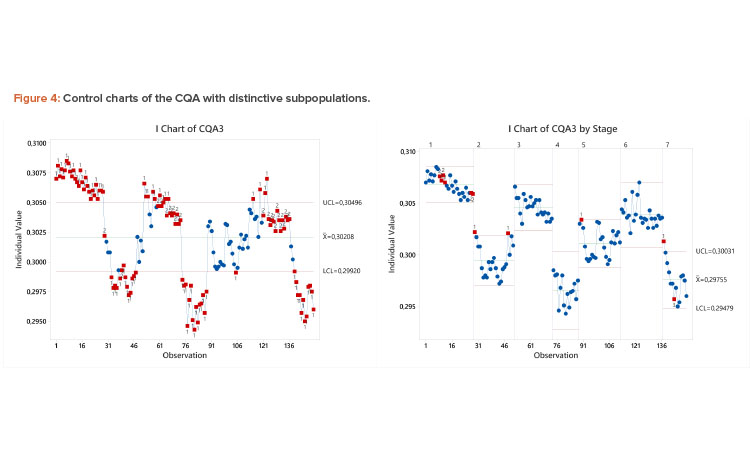
Case Study 3: Process with Shifts
Unlike the previous example, the pattern in the control chart in Figure 4 has distinct, nonrandom clusters of data, possibly due to campaign-to-campaign variation, raw material changes, QC testing series, etc.
Hence, these data violate the IID assumption, and control limits and the Ppk of 0.72 computed using the entire dataset are unreliable (capability analysis not shown). The likelihood of failure is much lower than associated with this Ppk value. In this case, the Cpk value of 2.75 considering the process capability by subpopulation more accurately reflects the overall likelihood of failure. The high capability by subpopulation is obvious in the control chart split by campaign, where control limits are well within the USL of 0.31. Although there is opportunity to improve the consistency of this parameter by identifying the cause of the shifts, the motivation should not come from a need to improve overall Ppk, as the true capability risk is medium to low.
When the influence of process nuances and data characteristics is understood, an effective risk-based approach to quantify risk and prioritize resources using process capability metrics is possible.
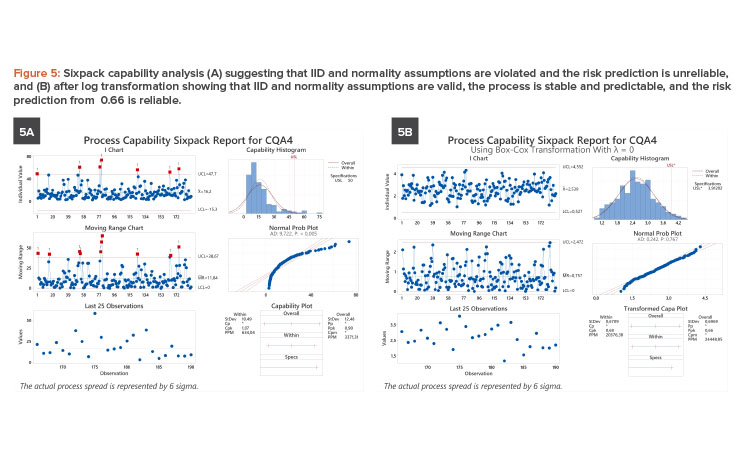
Case Study 4: Non-Normal Data
The evaluation of 183 batches of a parameter with an upper specification of 50 units led to a Ppk of 0.90. The sixpack analysis (see Figure 5A) showed that both IID and normality assumptions were violated, leading to an unreliable Ppk. The data have a lower bound of 0 units and are skewed to the right. The underlying distribution is truly non-normal; hence, a transformation is appropriate. A log transformation resolved IID and normality issues (see Figure 5B). The transformed specification limit of 3.912 units results in a reliable of 0.66. This low value in addition to seven OOS events translate to high risk, and this parameter is identified for process improvement.
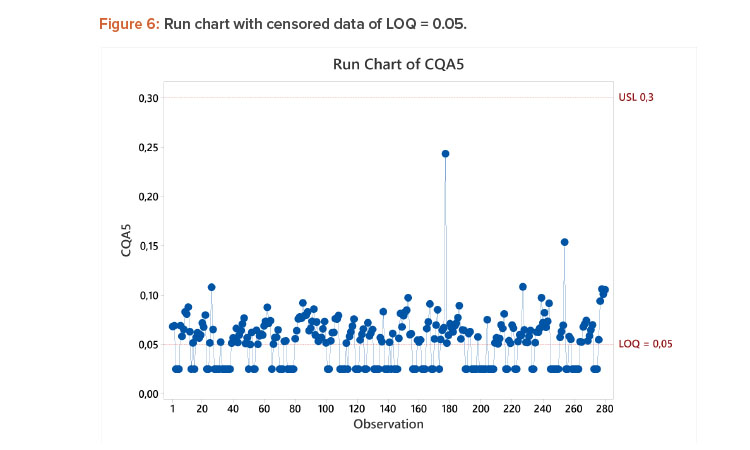
Case Study 5: Censored Data
Censored data are a common issue with measurements of byproducts and biological impurities, due to many results being less than the limit of quantification or detection (< LOQ or < LOD). A summary article written by Haas and Scheff9 compares different methodologies for the estimation of the true mean and standard deviation for data sets containing results below a known detection limit. Such methods can be useful to derive Ppk, but should be applied only in cases where less than 50% of the data are censored. In many cases of censored data, as in this case study, computation of Ppk is not necessary to assess risk. In Figure 6, it is clear that the risk of exceeding the specification limit is low based on the annotated run chart. In such cases, the metric % < LOQ across a fixed number of batches could be useful to evaluate ongoing performance.
Conclusion
The assessment of process capability is critical to assure ongoing product quality and assign resources to products with higher risk of supply and regulatory risk. It can easily be incorporated into a risk-based approach to evaluate process performance and plan commensurate actions.
Although the formulas for common process capability metrics such as Cpk and Ppk are simple and intuitive, the accuracy of these estimates relies on underlying assumptions for the data and associated process. Because these assumptions are often not met in pharmaceutical manufacturing, assessing process capability in this environment can be more complex than a simple metric. These cases require a deeper understanding of the data, including the influence of the data structure on the estimate of the process capability index. Additional evaluation may also be required. In many cases, the risk assessment is limited to a practical evaluation of process capability by the SME.
When the influence of process nuances and data characteristics is understood, an effective risk-based approach to quantify risk and prioritize resources using process capability metrics is possible. This approach ensures product quality and limits wasteful activities, thus aligning with the patient needs of the “right medicine, at the right time, at the right cost.”


