Automating MACO Calculations in Cleaning Validation
For a multiproduct facility where equipment is shared, there is always a risk from cross-contamination. The correct calculation of the cleaning validation limits from maximum allowable carryover (MACO) of a marker compound to the next product is vital for the integrity and success of the cleaning validation program. However, the process yielding those limits often involves cumbersome, error-prone manual calculations. Herein, we describe an innovative yet simple tool that uses a combination of spreadsheet software and a statistical platform to fully automate science- and risk-based MACO calculations in pharmaceutical cleaning validation.
A reliable cleaning validation program is essential to GMP manufacturing and helps enable a manufacturing unit to deliver quality products on time and in full to market. The success of this program—along with other quality and compliance programs such as process validation, corrective and preventive action (CAPA), and change control systems—is an important prerequisite of a well-instituted quality management system.
The pharmaceutical industry has come a long way in embracing the value of cleaning validation programs for seamless manufacturing. Health and regulatory agencies such as the US FDA,1 EMA,2 and Health Canada3 and organizations like ISPE,4 the Parenteral Drug Administration,5 Active Pharmaceutical Ingredients Committee,6 and ASTM International7 are deeply committed to educating the pharmaceutical community by developing and sharing content built on the foundations of good GMP principles and best practices.
In the past two decades, there has been considerable discussion on how to identify the marker compound (the product most difficult to clean based on solubility, toxicity, therapeutic dose, and degradation potential, also referred to as the worst-case product) and calculate MACO risk of the marker onto the next product. The industry has made a significant leap from releasing equipment solely based on visual criteria to establishing acceptance cleaning limits based on science and an understanding of the risks associated with manufacturing different products/dosage forms in a facility. Today, the criteria for both visually clean and acceptable residue of the active substance/cleaning agent for equipment release are embedded in most companies’ quality management systems.
There is general agreement among health authorities and technical groups that the MACO should be scientifically calculated through one or more industry-recognized approaches (health-based, therapeutic, toxicological, and 10 parts per million [ppm] methods), leading up to derivation of a cleaning validation acceptance limit. There are, however, differences of opinion and differences of approach both within and between companies regarding the ways MACO is calculated and reported. The objective of this paper is not to recommend one approach over another but to describe the creation of a program that would harmonize the standards within the company, remove confusion, and produce error-free output for cleaning validation limits while allowing users to have all available information. The final decision of which limit to choose resides with the technical and quality staff and requires appropriate justification. The goal throughout the selection process is to demonstrate that the carryover amount of an API will not pose a safety risk to the end user.
As reported by Walsh,8,9 the methodology used to calculate and maintain cleaning validation limits can be cumbersome and, at times, error prone. The results are calculated and generally reported as data tables in a spreadsheet (e.g., Microsoft Excel). With time, as new products and equipment are introduced and others decommissioned, these spreadsheets grow and can become difficult to maintain and comprehend. It is not uncommon to find that information about the marker compound and MACO is not updated with the introduction or decommissioning of products or equipment. This can cause serious issues, perhaps leading to non-compliance and/or recall, depending on the gravity of the miss. There is also a risk of knowledge loss during the transfer of these documents, especially in organizations that rely heavily on manual processes.
The authors of this paper (referred “we” or “the central team”) have developed and validated an innovative yet simple tool to fully automate clean-ing validation calculations in a compliant and user-friendly manner. This original paper presents the prerequisites, methodology, validation, and technology used to develop the program. We also describe the final report containing data tables, graphs, contextual text, and concluding remarks, along with raw data and formulas, which can be treated as a GMP document for audit and inspection purposes. We refer the tool as the cleaning validation limit macro (CVLM).
CVLM Overview
In its original usage, a macro is a user-defined function designed to reproduce a sequence of inputs performed within a software application, often created by recording a sequence of actions. Within Microsoft Office applications, Visual Basic for Applications (VBA) replaced the macro languages that existed in earlier versions. Programs written in VBA and similar application-specific languages are thus often referred to as “macros,” even though the programs concerned are often a great deal more sophisticated than a simple recorded automation sequence.
The CVLM is written in Statistica Visual Basic (SVB), a Visual Basic variant that allows automation of the data analysis and graphical capabilities of Statistica. The program is not an algorithmic model in its strictest sense, but it utilizes a set of deterministic equations. The macro exploits these capabilities to produce customized graphs and tabular output, which are embedded in a time-stamped report document, along with dynamically produced explanatory text.
The CVLM is deployed via a secure enterprise-level system, ensuring that all users have access to the most recent validated version.
Development Process
With support from leaders of manufacturing sites, we identified validation, quality, technical, and engineering representatives to establish a “local-team” framework. The local teams collaborated with the central team to provide
- the list of the products manufactured (and APIs used) in their respective sites;
- physicochemical data on the APIs’ solubility, toxicity, potency, and cleanability to be used in calculating the MACO;
- the list of cleaning agents with their composition, acceptable daily intake (ADI), and safety data; and
- relevant local and regional regulatory policies affecting cleaning validation.
The criteria used to select the internal manufacturing sites were based on the sites’ geographical locations, experience with manufacturing different dosage forms, competency levels, and readiness to support this program. The decision to initially include only a few manufacturing sites complemented the “agile development” approach of the program, which allowed feedback to be received at the development stage and used to address gaps in real time. The contract manufacturing organization/third-party sites were not included in the program scope due to contractual limitations and complexities associated with managing the multiple and diverse quality management systems under one program.
Based on the knowledge gained of the program “wants” from local teams, we developed a blueprint or user requirement specification (URS) for the CVLM program with the following design principles in mind.
Science- and Risk-Based Program
The literature offers, with some nuances, plenty of information on ways to identify the marker compound and calculate MACO. The approaches currently used in the industry are varied, and at times disjointed, and may sometimes involve data sources and modes of calculations that are incorrect or unverifiable. The lack of a reliable validated system can promote the overuse of “visual clean” (equipment dried and free of visible dirt on the surface) as the sole criterion for equipment release after cleaning. In addition to reducing the complexity of identifying the marker compound and making the calculations error-proof, the CVLM program is at its core based on the use of science- and risk-based principles where quantitative determination of MACO/cleaning limits through swabbing or rinsing is used to make quality decisions.
Thus, it was decided that the CVLM program shall leverage already established science on MACO through four commonly used methods and use of a product-equipment matrix. The program should be flexible, defensible (stand the test of regulatory inspections), and relied upon for quality decisions.
Data Management Tool
The CVLM has a standardized file format where data on actives, cleaning agents, manufacturing, cleaning, and so on, will reside. Excel was selected because of its familiarity, ubiquity, and the ability to implement audit trail/traceability functionality.
Statistical Software
Statistica was chosen for the analysis platform because it is the standard, validated, statistical software used in our organization, which has trained users at every site. We started with version 12.0 and the most recent version installed is version 13.5. Any other similar tool with an integrated macro language (e.g., JMP or Minitab) and the capability to import external data files could have been used.
Computational Details
It is not our intent in this paper to dive deeply into the history of the MACO evolution, but a brief discussion is necessary to apprise readers of the criteria followed for risk rating and identification of the marker compound.
| Solubility Definition | Parts of Water Required for 1 Part of Solute | Risk Rating |
|---|---|---|
| Very soluble (VS) | <1 | 1 |
| Freely soluble (FS) | 1–10 | |
| Soluble | 10–30 | |
| Sparingly soluble (SPS) | 30–100 | 3 |
| Slightly soluble (SS) | 100–1,000 | |
| Very slightly soluble (VSS) | 1,000–10,000 | 5 |
| Practically insoluble | ≥10,000 | |
| Toxicity | Oral LD50 (single dose to rats), mg/kg |
Risk Rating |
| Practically nontoxic | >5,000 | 1 |
| Relatively harmless | ||
| Moderately toxic | 500–5,000 | 3 |
| Slightly toxic | ||
| Extremely toxic | ≤500 | 5 |
| Highly toxic | ||
| Potency | Concentration, mg/kg | Risk Rating |
| Low risk | >10 | 1 |
| Medium risk | 0.5–10 | 3 |
| High risk | <0.5 | 5 |
| Ease of Cleaning | Criteria based on operator/cleaning specialist feedback | Risk Rating |
| Easy | 1 | |
| Moderate | 3 | |
| Difficult | 5 |
Marker Compound Identification
Factors such as solubility, toxicity, potency, and cleanability of an API play a pivotal role in the development of a cleaning process. The marker compound is determined from the formula with risk factors that are unique to each API. We employ the following formula for risk rating, where the APIs’ parameters, based on their role and criticality in cleaning, follow the order of solubility (SOL) > toxicity (TOX) > potency (POT) > ease of cleaning (EOC):
Risk rating = (SOL × 10) + (TOX × 6) + (POT × 4) + EOC
The parameters are assigned a severity rating of 1, 3, or 5, based on the API’s physical, chemical, and toxicological data from USP10 and the OPP/GHS11 ratings (Table 1). The assigned value of each parameter is multiplied by an arbitrary number of a magnitude that brings adequate separation and matches with the order of criticality. However, the formula could be modified according to any organization’s product range and quality requirements.
When the formula is executed, it assigns a risk value to each of the actives in scope. The API receiving the highest value is identified as the marker compound. Where two or more APIs show the exact same risk rating, the selection can be based on relative toxicity, frequency of batching, or any other factor as justified.
MACO Calculation
The CVLM program calculates MACO using four methods: health-based exposure limit (HBEL), therapeutic dose, toxicological, and 10-ppm approaches. Different safety factors were used, depending on the route of administration, and as accepted widely by the industry. Table 2 shows the formulas used in the CVLM.12
In the case study later in this article, the median lethal dose (LD50) was used to calculate ADI. However, depending on the stipulations of the quality management system in the organization, ADI determined from animal toxicological studies (overt toxicity, biomarkers, exaggerated pharmacodynamic effects) to derive a safe starting dose in humans can also be used, if available. Irrespective of the approach used, the macro can easily be adapted to incorporate future changes.
Cleaning Validation Limit/Acceptance Criteria
Before the cleaning validation limit is assessed and applied, an analytical method with adequate sensitivity, specificity, and recovery should be developed and validated. The sampling of the cleaned surface with a suitable swab material or rinse solvent is an important next step to calculate the cleaning validation limit. Generally, predefined areas (usually 10 cm × 10 cm) are swabbed or rinse samples are collected with a known volume of solvent. The formulas used to calculate the swab or rinse limit for each MACO are as follows:
Swab limit (mg⁄swab)=MACO(mg)Surface area(cm2)×Swab area(cm2)
Rinse limit (mg⁄rinse)=MACO(mg)Rinse volume(mL)
For each method of calculation, the lowest MACO and cleaning limit are obtained and proposed as acceptance criteria for cleaning validation. For most cases, the selection of the limit is straightforward and based on patient safety; however, there are other factors that could impact the selection, requiring further assessment. The technical and quality staff are responsible for the final decision with appropriate justification.
Excel Database
The Excel database (the structure of which is described in detail later) used to manage the source data for the Statistica CVLM has multiple worksheets. For example, an API table worksheet contains data for HBEL, LD50, and solubility ratings for each API, and a formula table contains data for the minimum batch size of the next product (grams), ease-of-clean risk, and adult/child designation for each formula. If the product is meant for both adults and children, the user is instructed to use the child bodyweight for a conservative estimate. Details that could be helpful in developing an equivalent system include:
- The system checks for duplication of data, such as multiple entries for the same API or formula.
- The system alerts the user with warning messages when any inconsistent information is entered.
- The system allows some cells to be left blank and the database saved for later completion.
- The Windows clipboard may be used to paste information, provided that the validation rules are met.
- A non-editable audit trail is created automatically, logging all changes to the data, with user ID and time stamp.
| MACO Type | MACO Formula |
|---|---|
| HBEL | HBEL×MBSMDD |
| Therapeutic | MTD×MBSSFt×MDD |
| Toxicological | ADI×MBSSFt×MDD |
| 10 ppm | (10 × 10–6) × MBS |
Key: ADI: Acceptable daily intake, (mg); HBEL, health-based exposure limit value of the previous
product (mg/day); MBS, minimum batch size of the next product (mg); MDD, maximum
daily dose of the next product (mg); MTD, minimum therapeutic dose of the previous product
(mg); SFt, therapeutic safety factor. SFt was set at 1,000; being in the denominator, it makes
the result more stringent. The program converts all values to milligrams for ease of data
manipulation.
As described later in this article, the database template was validated before the official rollout of the program. For the scoping brief, six global pilot sites were identified and, after validation, the sites were advised to save the master template as a local copy and populate it with their own data, as necessary.
In use, the database is maintained and controlled by the sites for all products manufactured. Once fully populated, the database file can be quickly updated to add or remove any information and assess the impact on existing cleaning validation procedures. The audit trail is a key feature of the database as it records all data entry, modification, and deletion actions. It also serves as a control mechanism for GMP review and audits.
Macro Design and Operation
The macro is modular in design to allow easier maintenance and future updates, such as new methods of calculation or changes to address regulatory requirements. Separate subroutines were written for each method of calculating MACO, risk ratings, and limit values; each graph and table of results; and supporting functions such as report creation and text formatting.
Graphical and Tabular Output
The calculated results are reported in tables and graphs. The graphical output can be used to quickly and easily compare results, whereas the tables provide additional detail and full numerical precision.
Two graphs are produced and included in the report output (see the case study later in this article for an example):
- A risk rating plot shows the overall risk rating for each formula/API combination, sorted so that the compound with the highest risk (the marker com-pound) appears at the top. The plotting symbol and color are determined by the toxicity rating, whereas the batch size is displayed as a label.
- A MACO plot shows all four calculated MACO values for each formula/API combination, sorted so that the compound with the lowest MACO value (from all the methods) appears at the top.
Program Operation
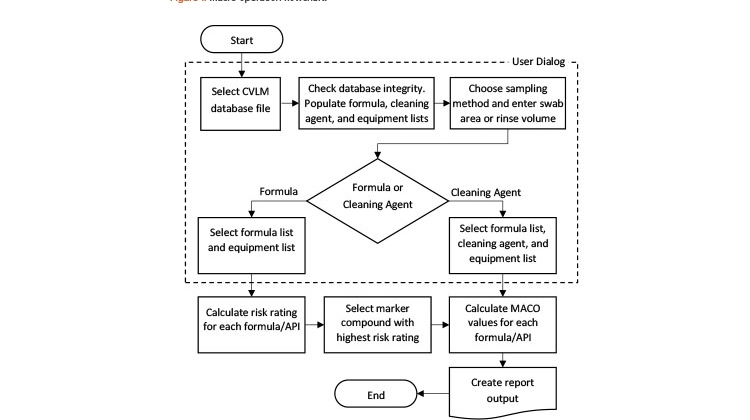
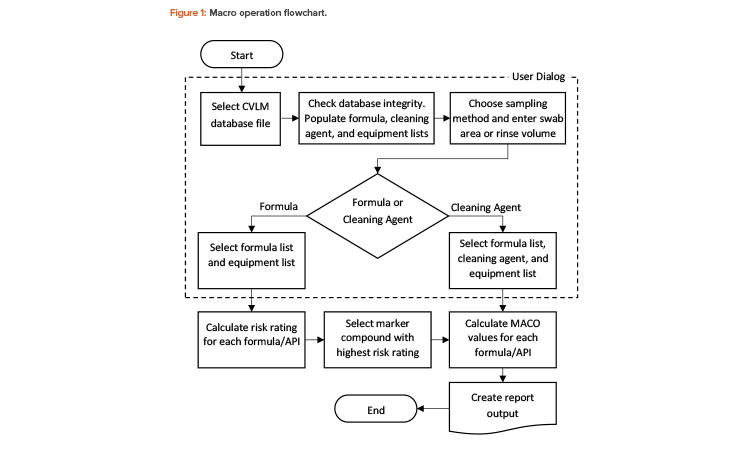
The flowchart in Figure 1 shows the steps that are processed within the user dialog during program operation. These are illustrated further in the case study.
User interface
On execution, a dialog is displayed that allows the user to select a CVLM database file. A database integrity check is then performed to verify that a valid database file containing at least the minimum required information has been selected. The dialog then allows the user to choose a sampling method and quantity (area for “swab,” volume for “rinse”) and either “formula” or “cleaning agent” approaches. If the cleaning agent option is selected, dialog controls offering the formula, cleaning agent, and equipment lists obtained from the database file are activated. If the formula option is selected, only the formula and equipment list controls are shown. The formula and equipment controls both allow multiple items to be selected, whereas the cleaning agent control allows only a single item to be selected.
The dialog checks that all necessary information has been provided before allowing the calculations to proceed. A secondary dialog is used to collect the number (count) of each selected piece of equipment required for the current equipment train, up to the maximum number specified in the database file.
Computations and report output
After the user selections have been completed, the macro proceeds to perform the necessary calculations and produce the output report. The individual tables and graphs, along with other supporting results, are also stored in a Statistica output workbook, where the output can be further customized or used as input for other analyses.
MACO calculations can only be performed where complete information is available. For example, if the database is missing the therapeutic dose variables for an API, only the HBEL, toxicological, and 10-ppm MACO values will be calculated for this API. Both the Excel database and the macro program have built-in notifications that alert the user of any missing data, and the program will not run if any critical pieces of information are missing. However, we took the approach that the software should perform all calculations possible with the available information, rather than simply refusing to proceed. The final decision about which method(s) to use is left to the user in accordance with company policies.
In addition to the main report, an event log, including any warning messages generated during the execution of the macro, may also be produced. The warnings produced may relate to the database integrity check, any APIs that are missing critical information, or any other issues that were encountered in the calculation of the risk rating, MACO values, and so on.
Case Study
The use of the CVLM is illustrated using an arbitrary example wherein two single-API products (A and B) share manufacturing equipment and their clean-ing validation may be impacted by the introduction of a third product (C, with two actives C1 and C2). The products described here as examples are all oral solid, non-film-coated tablets with one or multiple APIs.
Database File Setup
Multiple worksheets in the database are set up to provide the data needed to calculate MACO per the formulas shown in Table 2. The worksheets contain data on API, formula, API/formula (identifying the APIs within each formula), equipment, and cleaning agent, as shown in Table 3.
Running the Macro
The process to execute the macro is simple and consists of the following steps:
- Open Statistica Enterprise and run the CVLM application.
- Select the Excel database file.
- Specify the parameters for the analysis, including swab area/rinse volume, formula list, equipment list, and, optionally, cleaning agent.
- Specify the count for each item of equipment used.
- Perform calculations and create report.
The CVLM Report
The final report, which includes tables of results, graphs, and contextual text, is presented in a PDF file. The report also includes details on the formulas used, raw data, and products and equipment selected for analysis. The report may be added as an attachment to a validation protocol/report and made available to support any questions during an audit.
| API | ||||
|---|---|---|---|---|
| API | HBEL (µg/day) | LD50 (mg/kg) | Solubility Rating |
|
| A | 2,000 | 205 | 5 | |
| B | 400 | 415 | 3 | |
| C1 | 2,000 | 371 | 1 | |
| C2 | 250 | 840 | 1 | |
| Formula | ||||
| Formula | MBS (g) | Ease-of-Clean Rating |
Child/Adult | |
| A | 160,000 | 1 | Child | |
| B | 420,000 | 1 | Adult | |
| C | 316,800 | 3 | Adult | |
| Formula/API | ||||
| Formula | API | MTD (mg) | MDD (mg) | Label Claim (mg) |
| A | A | 200 | 400 | 200 |
| B | B | 20 | 40 | 20 |
| C | C1 | 30 | 180 | 30 |
| C | C2 | 1.25 | 7.5 | 1.25 |
| Equipment | ||||
| Equipment ID | Surface Area (cm2)* |
Maximum Number** |
||
| 1 | 14,350 | 1 | ||
| 2 | 29,183 | 1 | ||
| 3 | 72,197 | 1 | ||
| 4 | 2,266 | 6 | ||
| 5 | 60,560 | 4 | ||
| Cleaning Agent | ||||
| Cleaning Agent |
LD50 (mg/kg) | |||
| CA1 | 450 | |||
| CA2 | 1,153 | |||
*The program adds a 10% safety factor to the total surface areas.
**The maximum number refers to the pieces of equipment available for use in the manufacturing
of a product. The actual number used is selected by the user at run time.
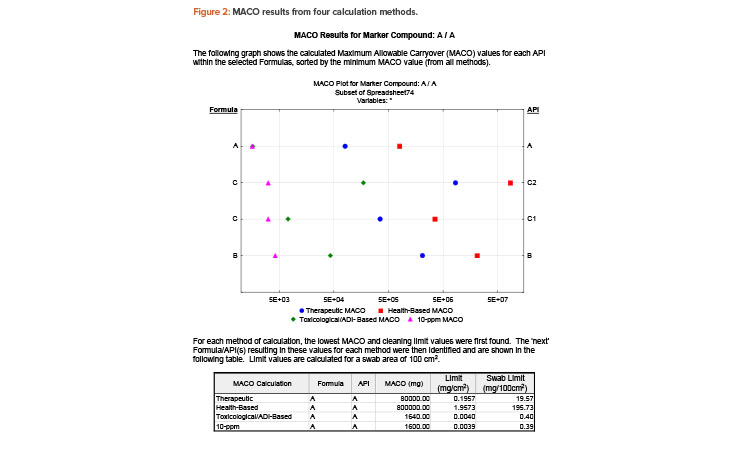
The graphical components make the report easy to understand and can be exported to other applications (e.g., slide presentation software) for management review. Figure 2 shows an excerpt from the report output.
Based on the results shown in Figure 2, the 10-ppm method shows the lowest MACO and cleaning validation limit for marker compound A. In this example, the lowest limit (390 μg/swab area) is indeed less stringent than visual clean, as most residue would be visible on the surface at this limit. So, for routine cleaning, an argument can be made that visually clean could be the sole criterion for final equipment release, thus removing the need for swabbing and testing (periodic monitoring may still be needed). Showing all the calculations makes the final decision robust and defendable.
Validation
Because the database and the Statistica macro both use GxP data and the macro output is used to make product quality and compliance decisions, the database and macro required validation. The validation was protocol driven and similar in design to computer systems validation, as test cases were created and executed with predefined acceptance criteria, including the following stages:
- Requirements specification: This details the system requirements, business requirements, and any other GxP requirements.
- Design specification: Both the Excel and Statistica components included custom-written code and, as such, needed a design specification with application-specific configuration details.
- Code review: This confirms that the code developed will accommodate the system requirements and will function as described in the design specification.
- Testing: All GxP requirements require testing.
- Report: The report provides a reference to testing protocols and a summary of how the deliverables of the validation have been met.
A pilot group of selected production sites used the system extensively during development. Any identified bugs were reported, and issues addressed, before a new release was uploaded into the development area for further testing by the pilot group.
Program Benefits
The program offers multiple benefits, such as the following:
- Error-proof MACO results for all four recognized calculation methods
- The program can be built in-house using existing software, with no extra licensing fees
- Efficiency—report output is already a GMP document and takes only a few minutes to create
- Rapid and traceable results with easy-to-update variable data
- Allows calculation of acceptance criteria for swab and rinse samples
Conclusion
The development, execution, and validation of the CVLM provides a reliable tool to simplify and automate the cleaning validation calculations to support a compliant cleaning validation program. Thus, the CVLM program can help sites make informed decisions to continue supplying products to market on time.
About the Authors


