Technical
March / April 2018

Parenteral HEPA Filter PM Interval

Daniel C. Carroll
Thomas R. Spearman, PE
Article

This article shares a process used to evaluate terminal HEPA filter maintenance programs serving a parenteral manufacturing plant. The evaluation determines whether maintenance history data supports extending preventive maintenance frequency.

Terminal HEPA filters in HVAC applications serving Grade B, Grade C, Grade D, CNC, and unclassified areas are included in the evaluation. "Grade" is used throughout to refer to the EU GMP Annex 1 1 classifications of areas served by HEPA filters. Unidirectional airflow HEPA filters are excluded from the evaluation, since they have significantly higher failure rates than terminal HEPA filters.

HEPA filter preventive maintenance (PM) tests the following attributes using a procedure based on the Institute of Environmental Sciences and Technology Standard IEST-RP-CC034: HEPA and ULPA Filter Leak Tests:2

  • Integrity: An aerosol challenge test. The acceptance criterion is that filter penetration is less than 0.01% of the upstream concentration.
  • Airflow: A rate limits test. The acceptance criterion is that airflow is 10% above the air volume needed to provide the area with the minimum air changes per hour.
  • Differential pressure: A static pressure-drop test. The acceptance criterion is that pressure drop is less than twice the initial pressure drop established at installation.

Failure modes analyzed in the evaluation are:

  • Media leak: A leak in the filter medium itself, such as a pinhole.
  • Housing leak: A leak in the housing that holds the filter, including a gasket leak.
  • Media damage: A leak caused by touching or scraping the filter medium during testing, when protective grills are removed so that the filter medium can be scanned. Damage can occur during grill removal or replacement.
  • Low airflow limit: Air volume necessary to produce minimum required air changes per hour:
    • Grade B areas: 20 air changes per hour Grade
    • C areas: 20 air changes per hour
    • Grade D areas: 15 air changes per hour
    • Grade D gown rooms: 20 air changes per hour
  • High differential pressure: Exceeding twice the initial pressure drop established at installation.

The air supply volume required to produce the minimum air change rates is calculated per filter and specifi ed in cubic feet per minute or cubic meters per hour.

When the testing acceptance criterion is not met, a corrective action or preventive action (CAPA) event is originated. As part of the investigation, environmental monitoring data from the affected area is examined. From 1 July 2011 to 31 October 2015 (the time period covered by this article), no event investigations connected an environmental excursion to a HEPA filter failure. As a result, product quality was not affected.

HVAC system overview

Cleanroom HVAC systems supply high-quality filtered air low in microbial and particulate load to all processing areas, with temperature conditions that minimize microbial proliferation while maintaining operator comfort. Air-handling units that supply classified areas force air through prefilters, removing particles larger than 0.3 micrometers (μm) with an efficiency of 95%. After passing through supply ductwork, air is terminally filtered through HEPA filters with a minimum efficiency of 99.97% for particles greater than 0.3 μm for Grade C and D areas, and a minimum efficiency of 99.99% for particles greater than 0.3 μm for Grade B areas. HEPA filtration is not required for controlled not classified (CNC) and unclassified applications.

HVAC systems are designed to maintain cascading air pressure differentials between areas of differing classification (Grades B, C, and D). A minimum 0.04 inches of water column (10 Pascal) pressure differential is maintained between adjacent areas of lower grade. Grade C raw material sampling and dispensing suites are maintained negative to adjacent areas to facilitate containment. Air pressure differentials are continuously monitored, recorded, and alarmed.

* High-efficiency particulate air filter

† Ultra-low-penetration air filter

‡ FDA regulatory requirement; see reference 3

Table A: HEPA Filter Failures from 1 July 2011 to 31 October 2015
Failure Mode Failures
Media leak 69 1.4%
Housing leak 29 0.6%
Media damage 3 0.1%
Low airflow 2 0.0%
High differential pressure 0 0.0%

Weibull distribution

Developed in 1937 by the Swedish scientist and engineer Waloddi Weibull, the Weibull distribution is the leading method for fitting and analyzing equipment life-cycle data. Organizations such as the US military, Pratt & Whitney, and General Motors further developed the method.

The two-parameter Weibull distribution is widely used for life data analysis. The Weibull cumulative distribution function (CDF), shown in the equation below, provides the probability of failure up to time t 4 .

$$F\left(t\right)=1-\ e^{{-(\frac{t}{\eta })}^{\beta }}$$

where:

F(t) = fraction failing up to time t
t = failure time
e = natural logarithm base
ƞ = characteristic life or scale parameter
β = slope or shape parameter

The complement of the CDF is reliability or the probability the failure will not occur up to time t. The reliability function is shown in the equation below.

$$R\left(t\right)=e^{{-(\frac{t}{\eta })}^{\beta }}$$

where:

R(t) = fraction passing up to time t
t = failure time
e = natural logarithm base
ƞ = characteristic life or scale parameter
β = slope or shape parameter


β(beta) shows the class of failure modes:

β < 1.0 indicates “infant mortality,” a failure rate that decreases over time
β = 1.0 indicates random failure or failures independent of age
β > 1.0 indicates wear-out or increasing failure rate over time

The Weibull charts in this article have plotted the reliability function and are labeled “passing rate” on the vertical axis.

Figure 1 is the Weibull distribution plot for HEPA filters with a media leak failure mode. The plot consists of a horizontal scale illustrating the age to failure and the reliability function (1-CDF) on the vertical axis.

The ƞ (eta) for this distribution is 11,100 days, indicating that 63.2% of the filter population will have failed due to a media leak by this point. The β (beta) is greater than 1, indicating a wear-out pattern.

The probability value estimate percentage (pve %) is greater than 10%, indicating that the mathematical model represents the data and is safe to use for life data.

    Figure 1: Weibull Diagram, Media Leaks
    Figure 1: Weibull Diagram, Media Leaks
    Figure 2: Weibull Analysis, Housing Leaks
    Figure 2: Weibull Analysis, Housing Leaks

    “The Weibull Distribution is the leading method for fitting and analyzing equipment life-cycle data” 

    The occurrences/suspensions (o/s) summarize the failure points plotted on the graph (occurrences) and those that are included in the model but not plotted (suspensions). Suspensions are units that failed by a different mode or have not failed at all and are “suspended.” Although not directly plotted, suspension data affects the median rank of the data, which affects the vertical axis position.

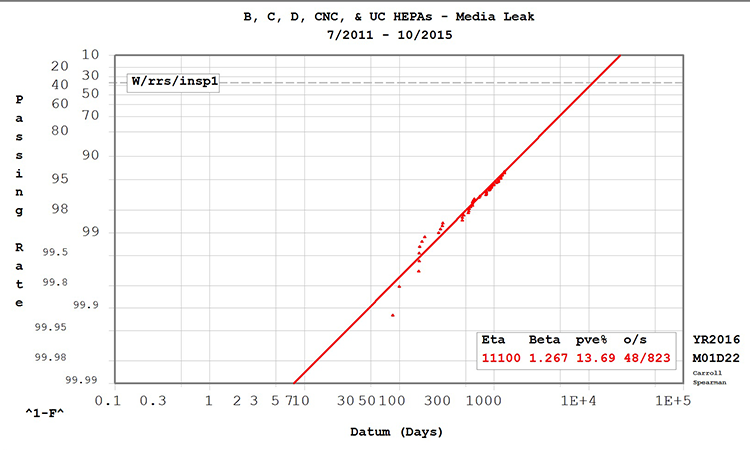
    To determine how long 98% of the filter population will survive a media leak, locate 98% on the vertical axis, find where it intersects with the Weibull line, then determine the life expectancy from the horizontal axis. In Figure 1, this occurs at 510 days.

    Results

    Weibull distribution analyses were performed on HEPA filter PM work orders dating from 1 July 2011 to 31 October 2015, using the maintenance history for 804 HEPA filters. Each work order with a failed tolerance code was reviewed to determine the failure mode. Weibull analysis software was used to calculate the proposed intervals at the 90%, 95%, and 98% passing rates (Figures 1 and 2). Table A summarizes the number and percentage of failures during the time period by failure mode.

    Table B, Table C, and Figure 1 summarize the Weibull analysis results for media leaks. Table B displays the data set by grade and as a complete group. The Weibull interval indicates the time period necessary to achieve the Weibull pass rate.

    Table C shows proposed PM intervals at passing rates of 90%, 95%, and 98%. The criticality of the filter relative to the area classification determines the desired passing rate.

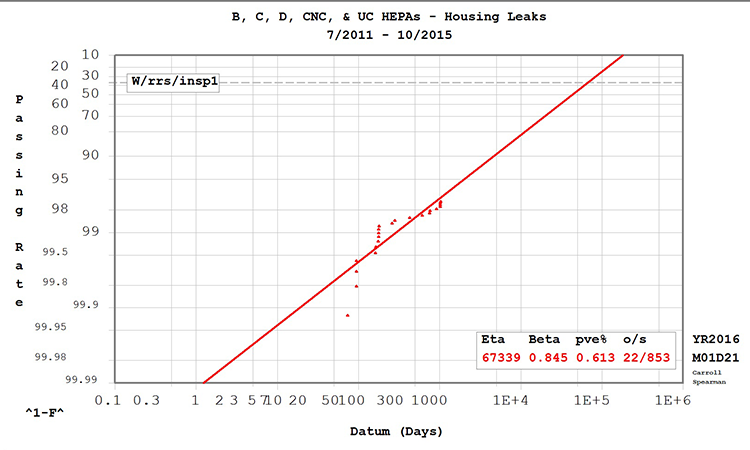
    Table D, Table E, and Figure 2 summarize the Weibull analysis results for housing leaks. Table D summarizes the data set by grade and as a complete group.

    Table B: Weibull Analysis, Media Leaks
    APPLICATION WORK ORDERS PM
    QUANTITY
    β PVE, % WEIBULL
    PASS
    RATE, %
    INTERVAL
    DAYS YEARS
    Grade B 183 1.238 80.08 98.7 265.1 0.7
    Grade C 1,222 249 1.052 2.47 97.6 394.7 1.1
    Grade D 1,166 218 1.135 39.67 99.2 457.9 1.3
    CNC 732 147 1.708 69.53 98.8 471.2 1.3
    Unclassified 31 7 1.000 n/a 100.0 n/a n/a
    All 4,805 804 1.267 13.69 98.60 385.4 1.2


    Table C: Weibull Analysis, Media Leaks, Proposed Pm Intervals by Passing Rates
    APPLICATION PROPOSED PM INTERVAL
    Days Years Days Years Days Years
    98% 95% 90%
    Grade B 376.5 1.0 798.9 2.2 1,429 3.9
    Grade C 331.1 0.9 803.0 2.2 1,592 4.4
    Grade D 1,032.0 2.8 2,345.0 6.4 4,421 12.1
    CNC 636.9 1.7 1,099.0 3.0 1,675 4.6
    Unclassified 161.3 0.4 409.6 1.1 841.3 2.3
    All 510 1.4 1,064.0 2.9 1,878 5.1

    Table E summarizes the proposed intervals at passing rates of 90%, 95%, and 98%. The criticality of the filter relative to the area classification determines the desired passing rate.

    Although a Weibull distribution was created for each classification, filter function is identical for each application. HEPA filters in all classification areas are installed, commissioned, qualified, and maintained similarly. The filter and housing design are the same, as are the failure mode and failure detection methods. A single population of HEPA filter failures, therefore, was used to determine future inspection frequencies.

    Three failure modes not associated with time were ruled out. Media damage was excluded because it occurs during intrusive activity, when the protective grill is removed. It’s important to note that testing HEPA filters too frequently risks unnecessary damage to the filter medium. During the period analyzed, filter damage during testing was documented three times.

    Low airflow was excluded because it is a system adjustment issue, and high differential pressure has no failure data.

    Media and housing leaks were the dominant failure modes and the only ones associated with time. Housing leaks, however, are considered an “infant mortality” failure mode: expected to decrease over time. The Weibull value also supports this. As a result, the proposed PM interval for housing leaks (Table E) is longer than the intervals proposed in the media-leak analysis (Table C) in all applications except for the Grade C.

    Media-leak analysis, therefore, is used as a basis for recommended PM intervals. These results are applicable to other cleanrooms that have similar tests for HEPA filters.

    Table D: Weibull Analysis, Media Leaks Data Set
    APPLICATION WORK ORDERS PM
    QUANTITY
    β PVE, % WEIBULL
    PASS
    RATE, %
    INTERVAL
    DAYS YEARS
    Grade B 1,654 183 0.791 100.00 99.9 54.02  
    Grade C 1,222 249 0.897 0.76 98.3 186.80  
    Grade D 1,166 218 1.000 n/a 100.0 n/a  
    CNC 732 147 0.649 32.35 99.5 1960  
    Unclassified 31 7 1.000 n/a 96.2 309.30  
    All 4,805 804 0.845 0.61 99.4 158.20  
    Table E: Weibull Analysis, Housing Leaks
      PROPOSED INTERVAL
    PASS RATE Days Years Days Years Days Years
    APPLICATION 98% 95% 90%
    Grade B 2,416.0 6.6 7,850.0 21.5 19,508.0 53.4
    Grade C 220.6 0.6 623.8 1.7 1,392.0 3.8
    Grade D 5,716.0 15.7 14,512.0 39.8 2,9810.0 81.7
    CNC 1,679.0 4.6 7,056.0 19.3 2,1394.0 58.6
    Unclassified 161.3 0.4 409.6 1.1 841.3 2.3
    All 663.5 1.8 2,000.0 5.5 4,689.0 12.8
    Table F: Recommended Pm Interval and Savings Summary
    APPLICATION GRADE B GRADE C GRADE D CNC UNCLASSIFIED
    Population 183 249 218 147 7
    Current PM interval 6 months 1 year 1 year 1 year 1 year
    Recommended PM interval 1 year 2 years 2 year After installation only After installation only
    Pass rate > 98% > 95% > 98% Not required Not required
    Labor savings, hours per year 366 249 218 294 14
    Savings per year $20,130 $13,695 $11,990 $16,170 $770

    Discussion and conclusions

    Using the data in Figure 1 and Table C, higher theoretical pass rates were selected for areas of higher classification, reflecting a risk-based approach. Since Grade B areas serve as background for the critical Grade A areas, a pass rate of > 98% was selected. Because the Grade C and D areas are used for such activities as equipment prep, formulation, vial washing, capping, and gowning, a pass rate of > 95% was selected.

    Table F shows recommended PM intervals based on these theoretical pass rates, as well as labor and cost savings calculated using the following assumptions:

    • The PM requires two people for execution
    • The PM requires 1 hour per person
    • The shop labor rate is $55 per hour

    Total labor savings are estimated as 1,141 hours per year. Total financial savings are estimated as $62,755 per year.


    Acknowledgments

    The author gratefully acknowledges the contributions of the following people to the development of this article:

    Susan Clauss, Brillig Systems; Beverly K. Flick, Crew Corporation; William Huibregtse, Eli Lilly and Company; Donald R. Moore, PE, Eli Lilly and Company; Ronald F. Reimer, PE, Eli Lilly and Company; Phillip Sergi, Eli Lilly and Company.