Calibration Performance Improvement Case Study
Calibration plays a critical role in ensuring a measurement instrument’s accuracy—especially if the instrument has a direct impact on product quality and patient safety. However, the calibration process is a complex system, and the traditional analytical approach for planning this process is often not sufficient to improve service performance. Using a digital simulation model as a representation of the actual situation allows creation of optimization scenarios for improvement purposes before they are implemented.
The pharmaceutical industry is highly regulated. Within its jurisdiction, each country has an authorized agency that closely supervises industry operations to protect the users of their products. Each country’s regulatory agencies have the obligation and authority to protect the drug’s consumer by safe-guarding the quality of the final products, assessing the production process and all facilities involved (buildings, instruments, machines, equipment, and utilities), and controlling the raw material used. 1
Instrument calibration is one of the regulation requirements that ensures the fulfillment of product quality and patient safety. Regulations expressly state that the pharmaceutical industry must carry out calibration activities for measurement instruments to ensure the quality of the products produced, the safety of the personnel involved in the manufacture of the product, the safety of medicinal product users, and the safety and sustainability of the environment.2
Calibration
Calibration ensures the accuracy of a measuring instrument throughout its traceable chain. The pharmaceutical industry must follow strict guidelines to calibrate each critical measuring instrument and ensure the quality of medicinal products produced as part of Good Manufacturing Practices (GMP) implementation.2
However, companies must also be competitive, carrying out organizational activities effectively and efficiently so that they can produce affordable medicinal products for patients. A smooth-running supply chain of industrial activities is important, not only for core activities (raw materials, production processes, finished goods, and distribution networks), but also for all supporting departments within the internal organization.3 Studies for bottleneck identification and process optimization in other industries have been carried over to the pharmaceutical industry for support functions, such as the quality control laboratory,4 that can provide regular quality inspection services for raw materials, work in process, and finished goods and balance them as to not disturb production processes.
In order to meet quality and technical requirements, a pharmaceutical company that also implements the calibration laboratory for internal support functions must also develop resources for calibration activities according to its respective provisions. Technical requirements include various resources that must be prepared, including highly trained personnel and their capabilities, calibration environment, equipment, and calibration methods. The high-level skills of calibration personnel and the existence of written detailed methods for each calibration activity are the keys to effective calibration services.5
The pharmaceutical industry has a range of measuring instruments of various types.5, 6, 7 For example, temperature-measuring instruments can range from simple portable glass thermometers to delicate thermo controllers located in complex sterilization systems. Each equipment item may require the development of its own unique method, although all methods must still refer to the concept of temperature calibration standards.8, 9, 10 Likewise, the development of calibration methods for other types of measuring instruments commonly used in the pharmaceutical industry must use necessary calibration method references, such as weight and balance calibration,11, 12, 13 pressure gauge calibration,14, 15, 16 and various other types of instrument calibration where the methods is developed specifically by the manufacturer of the instrument. This means calibration activities are varied.
Processing calibration data is used to issue a calibration accuracy certificate that also serves as a legal document. This data must also include the calibration uncertainty that can create complex systems for managing the thousands of instruments in a large factory area coverage.17 However, science and technology developments have created breakthroughs in data processing systems and calibration administration management.18, 19, 20
Instrument calibration in the pharmaceutical industry covers a scope that is as varied as the variety of instruments being calibrated, making a traditional mathematical analytical approach for planning insufficient. A system model approach that can mimic the real situation of the system is needed to accurately help provide an overview between calibration load and availability of resources and to make the right decision for optimization.
Simulation Model Approach
The simulation model approach used for the calibration laboratory area in this case study aims to act as an enlargement of the studies of simulation models that have been carried out in quality control laboratories in the pharmaceutical industry.4, 21 Simulation is one of the most widely used operations research and management science techniques.22 With a simulation model approach, we can study and complete experimental research for a complex system in many scenarios and observe the outcome in every simulation run to find the optimal solution for improvement.23, 24, 25
For pharmaceutical industry cases, simulation models have helped decision-makers improve system performance in quality control laboratory cases and production line manufacturing.26, 27, 28 Today, simulation has become a popular industry optimization tool because it can be embedded into smart factory components for building an Industry 4.0 concept as a key enabling technology for the availability of big data and the Internet of Things.29, 30, 31, 32, 33, 34, 35
Discrete event simulation as a specific terminology of operation research’s simulation model was introduced in 1950 as a scientific approach method to understand, improve, and optimize manufacturing processes in the industry. Discrete event simulation is also used as basic knowledge development of the digital twin model.36, 37
To build a simulation model of a system, a system boundary must be created at the initial stage with the necessary definitions and modeling of the simulation parameters, including location, entities, activities and delays, process logic, resources, and arrival rules.23, 25 Currently, a lot of simulation software can be used to generate random data distributions with patterns that resemble the conditions of the system and collect the simulation result to be observed and analyzed.38, 39, 40
This case study uses the discrete event simulation method and the simulation model is developed using ProModel 2016 software. Hypothesis testing of the developed simulation model showed no statistical difference between the simulation model and the actual situation, meaning the digital simulation model can be used as a representation of the actual situation and companies can then simulate improvement and optimization scenarios using this model.
Calibration Case Study
A pharmaceutical company in Indonesia with an internal calibration laboratory support function was chosen for the discrete event simulation application study. At the time the research was conducted, the company had 5,536 instruments registered as calibration objects with various periodic calibration intervals, instrument types, and calibration execution lead times. It was found that 97% of the instruments were calibrated by the company’s internal calibration laboratory, with around 30% of the calibrations completed inside the laboratory facility, and 70% completed onsite where the instruments were installed or located.
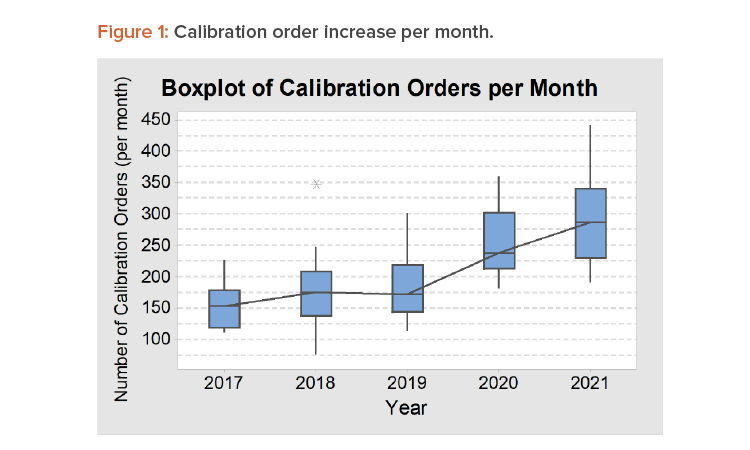
Periodically, calibration orders will arrive on a specific date, but random calibration orders also arrive daily—for example, for initial calibration for a new instrument, when a user requests calibration before a due date, or when a user finds an out-of-tolerance situation in a daily check that urgently needs recalibration. On average, the company had about 300 calibration orders requested per month in 2021. When reviewing these numbers, it should be noted that some calibration technicians put in unplanned overtime and about 8% of orders were for instruments past their calibration due date that had to be pulled from use until the required calibration was completed. Figure 1 shows the increase in calibration orders per month from 2017 to 2021, illustrated as a boxplot to show the variation between months in one year.
Traditional mathematical analytical approaches for trial and error experiments that use the actual system are too expensive. Further, the high degree of uncertainty and the randomness of calibration order arrivals make the study too complex for the analytical planning approach. The study used a discrete event simulation model and application software to mimic a calibration laboratory service situation. Such a model can be used to conduct experiments with the goal to determine optimized solutions for problem situations and to solve instrument calibration service performance problems.
Case Study Methodology
The method used in this research consists of the following steps:
Define calibration laboratory model design. The first step was to create a system model for the company’s calibration system. The system model was made according to the actual situation stages but was simplified to be easier to observe and analyze.
Collect data and fit statistical distribution. Data collection and statistical analysis were carried out at each stage of the calibration service process and on every step of the model. Goodness of data distribution fit test analysis was carried out; later it was used as a reference to generate random numbers in the simulation run.
Develop a discrete event simulation model. The model is developed to match the calibration laboratory service system. The simulation model is created using simulation software.
Verify the simulation model. The simulation model is verified with several samples of actual conditions to hypothesize whether there is a significant difference between the simulation model created and the actual conditions.
Study the optimal solution for calibration order demand scenario. Some scenarios to find the optimal condition are simulated assuming the estimated load of future calibration order.
Laboratory Model Design
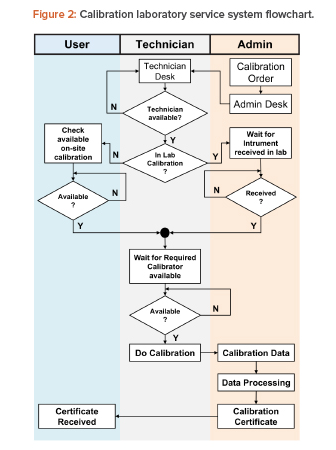
A typical pharmaceutical laboratory calibration system was observed to identify the process within the system. Figure 2 shows the calibration service process steps as a flowchart. The process begins with a calibration order that, in many cases, is an automatic, scheduled command received from the management computer system to complete the required periodic calibrations at specified intervals. The order can also be generated randomly based on user needs and requirements. The calibration order is then received at the administration desk and forwarded to the technician desk. The order is tasked to a technician, who takes the order to get calibration data.
There are two groups of calibration tasks:
- In the calibration laboratory (in lab): In the lab, there is a waiting time to send instruments from the user to the calibration laboratory, and a waiting time for calibrator availability.
- Onsite calibration: Onsite, there is a waiting time for equipment shutdown that will allow calibration to be carried out, and waiting time for calibrator availability. This group is further divided into three groups based on the travel time required from the technician desk to locations with different building groups, which are categorized into pharmaceutical product plants (onsite pharm), herbal product plants (onsite herbs), and plant category for food supplement (onsite food).
For both task groups, technicians will have random spans of time available to carry out work for another calibration order while waiting for instrument and/or calibrator availability.
The loading time for calibration based on time measurement samples has a certain data distribution pattern. After the calibration process is complete, calibration data is brought to the administration desk by technicians, which is then processed and ratified into a calibration certificate. Calibration certificates are sent to users as soft copy and distributed electronically.
For the study, the company had more than 5,500 instruments registered as calibration objects and an average calibration order of 300 orders per month. The calibration orders appeared spread over one month; however, on certain dates there was an automatic surge in demand as periodic calibration orders for instruments with a next-month calibration date came due. At the time of the study, the company had four calibration technicians performing calibrations. From the data collection, the technicians were performing calibrations only 30%-60% of the time, because their job also required carrying out machine qualification and process validation activities.
Data Collection
The required data were collected for calibration laboratory service activities for six months, from 1 January 2021 to 30 June 2021. The data were then processed and analyzed for a goodness-of-fit test distribution. An initial sample observation was completed in month 1. The goodness-of-fit test to the data distribution of calibration order arrives every month as the data obtained fit to an exponential distribution. Data in month 2 to month 6 were also analyzed and the goodness-of-fit results showed that all arrival data fit with an exponential distribution. It could then be justified that the calibration order arrival data follow a random pattern based on an exponential distribution.
The same method was used to measure the time of delays, including waiting time for the instrument to be available for calibration (to be received in the calibration lab for in-lab calibration or for equipment shutdown for onsite calibration), waiting time for the calibrator to be available, and the calibration activity duration. All data also have to be analyzed for the goodness-of-fit test distribution. The same analysis was carried out for data collection on delays and activities at the administration desk and technician desk, up to when the calibration certificate was received by the user.
System Model
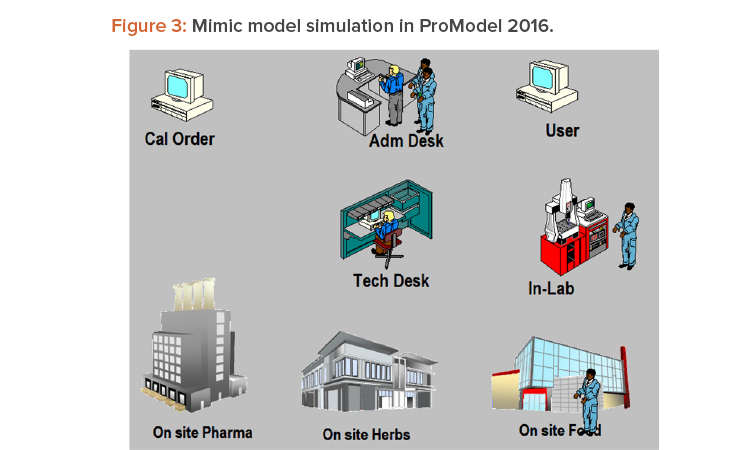
The discrete event system model was created using ProModel 2016 software with a mimic model simulation, as shown in Figure 3 and with the parameters shown in Table 1.
Model Verification
The model was then verified using the simulation, running with arrival distribution at the time of the data collection. The results were compared with the actual data to test statistically whether there were significant differences. The tested output collection statistics were: the number of exit calibration certificates (CalCert), average time of the orders inside the system (tavg-ent), and percent of utilization of time used by technicians to perform calibration activities against normal loading time (Tech-utl) with three technicians (at month 1, 2, and 3) and four technicians (at month 4, 5, and 6) as a resource. Table 2 shows the verification result.
The test using a two-sample t-test between the simulation model and the actual shows the p value for the number of exit calibration certificates (CalCert) is 0.360, for the average time of the entities inside the system (tavg-ent) is 0.255, and percent of utilization of time used by technicians to perform calibration activities against normal loading time (Tech-utl) is 0.974. Using a significance level of 0.05 indicates that all output statistic parameters collected from model simulation have p value more than 0.05. The p value is greater than the significance level, but there is not enough evidence to conclude that the difference between the simulation model and the actual situation is statistically significant.
Table 1: Parameter set on the model simulation built from analyzed data value.
| Input | Output | |||||||
|---|---|---|---|---|---|---|---|---|
| Location | Entities | Logic | Location | Entities | Logic | Probability | Operation Time | Move Time |
| Cal Order | CalOrd | Random | Adm Desk | CalOrd | No queuing | 100% | E(0.4) min | E(2.0) min |
| Adm Desk | CalOrd | Random | Tech Desk | CalOrd | Random | 100% | E(14.3) min | N(286.2,84.5) min |
| Tech Desk | CalOrd | Random | In Lab | CalOrd | Random | 38% | E(0.4) min | L(3832,2534) min |
| Tech Desk | CalOrd | Random | Onsite Phrm | CalOrd | Random | 30% | E(0.4) min | N(7726,3345) min |
| Tech Desk | CalOrd | Random | Onsite Herbs | CalOrd | Random | 13% | E(0.4) min | W(5.5,11466) min |
| Tech Desk | CalOrd | Random | Onsite Food | CalOrd | Random | 19% | E(0.4) min | N(5490,2503) min |
| In Lab | CalOrd | Random | Adm Desk | CalData | FIFO | 100% | E(14) min | E(2.5) min |
| Onsite Pharm | CalOrd | Random | Adm Desk | CalData | FIFO | 100% | E(79.9) min | E(3.1) min |
| Onsite Herbs | CalOrd | Random | Adm Desk | CalData | FIFO | 100% | W(2.1,51.8) min | L(16.1,2.1) min |
| Onsite Food | CalOrd | Random | Adm Desk | CalData | FIFO | 100% | W(1.2,140) min | N(20.7,2.9) min |
| Adm Desk | CalData | Oldest | User | CalCert | FIFO | 100% | W(1.2,3.9) min | EXIT |
E(a) means the data distribution fi t the exponential distribution with mean a; W(a,b) fi t the Weibull distribution with shape value a and scale value b; N(a,b) fi t the normal distribution with mean a and standard deviation b; L(a,b) fi t the lognormal distribution with mean a and standard deviation b.
Table 2: Verification result of the simulation model.
| Timeline | Number of Technicians | Total Hours | Arrival Logic | CalCert | tavg-ent (min) | Tech-utl (%) | |||
|---|---|---|---|---|---|---|---|---|---|
| Model | Actual | Model | Actual | Model | Actual | ||||
| Month-1 | 3 | 220 | E(30.26) | 261 | 239 | 9825 | 7516 | 42.50 | 54.17 |
| 254 | 10466 | 50.12 | |||||||
| 254 | 9422 | 50.00 | |||||||
| Month-2 | 3 | 223 | E(47.81) | 215 | 203 | 8936 | 11737 | 43.07 | 37.44 |
| 228 | 9356 | 43.32 | |||||||
| 198 | 8901 | 42.18 | |||||||
| Month-3 | 3 | 301 | E(42.15) | 304 | 274 | 9166 | 11742 | 44.01 | 40.26 |
| 301 | 9691 | 42.30 | |||||||
| 276 | 9167 | 42.59 | |||||||
| Month-4 | 4 | 273 | E(31.23) | 331 | 283 | 10090 | 10381 | 54.14 | 52.12 |
| 318 | 9921 | 53.71 | |||||||
| 317 | 10308 | 52.68 | |||||||
| Month-5 | 4 | 242 | E(47.11) | 204 | 218 | 8948 | 8711 | 29.88 | 34.26 |
| 229 | 8905 | 33.91 | |||||||
| 237 | 8668 | 37.79 | |||||||
| Month-6 | 4 | 312 | E(62.74) | 226 | 258 | 9356 | 9130 | 25.59 | 31.78 |
| 235 | 8771 | 27.96 | |||||||
| 238 | 9321 | 32.6 | |||||||
E(a) means the data distribution fit with the exponential distribution with mean a.
Proposed Improvement
The model was then used to create a simulation with an estimated load calibration order scenario for 2022. The 2022 scenario had an average of 350 orders per month, based on the analysis of the 2017–2021 orders and a 2022 order projection load (refer to Figure 1). The scenario used the normal number of technician hours available without overtime in one month, which is 173 hours; four technicians; and the arrival rule on the assumption of 350 orders per month, which is equivalent to an E(29.6) distribution. In this scenario, the results showed a 202 calibration certificates completed, with average time of orders within the system at 10,075 minutes and 54.29% technician utilization (this utilization is within the range that ensures time available for qualification and validation tasks). In this scenario, a large number of calibration orders were beyond past the due date (37.1%), so opportunities remain. Some improvements for optimization that can be analyzed from the simulation model run are as follows:
Completing 350 calibration orders per month followed by 350 calibration certificates per month can only be achieved if the four technicians are each scheduled for approximately 100 hours of overtime a month. The simulation model shows that adding technicians will not improve the calibration service performance.
Alternatively, a strategic initiative can be set with the objective to minimize significance delays. For example, considering at the most likely calibration situations—in-lab calibration and onsite pharmaceutical plant calibration—by reducing the delay time by 40%, the simulation shows that the system can complete 350 calibration orders and 321 calibration certificates per month. Using the simulation model, it is known the remaining orders can be accomplished with approximately 15 hours of technician overtime in one month. Another option is to increase investment so the in-lab capacity can be doubled, because this type of calibration has the highest probability of being successful. Simulation shows this strategy will allow competing 344 calibration certificates without requiring technician overtime.
Conclusion
This case study contributed to the current understanding of how using simulation methods to analyze calibrations laboratory services plays an important role in ensuring the accuracy of instruments used in supply chain production activities. The discrete event simulation model can be used to analyze a calibration laboratory system that has a high variation in job and workload, even though the complexity of each job is very diverse. The simulation model built at this level of the research demonstrates that the model verification results have no evidence to indicate that the difference between the simulation model and the actual situation is statistically significant.
For improvement with the investment decision—such as increasing in-lab calibration capacity or minimizing delays by providing redundant strategies for calibration objects and calibrator types of the highest probability orders—it is necessary to complete further studies on the cost-benefit analysis by running more simulation models. These models can provide data on the possibility of added value obtained from the investment.
In the future, more in-depth exploration can be done by adding the simulation logic that has been developed to the existing calibration management software program so the big data collection from calibration order records can be simulated and provide optimized decision options in real time and become a convincing tool for a digital twin model. This approach can be further developed for the digital twins model of a system.


