Technical
January / February 2020

Evaluation of Visual Inspection in Parenteral Products

Sambhujyoti Das
Article

According to US Pharmacopeia (USP) Chapter <790>, “all parenteral products should be essentially free from any visible particles.”1  This is the first and foremost requirement stated in all pharmacopeia for any injectable product. However, yielding absolutely particle-free injectable products is virtually impossible under real-life manufacturing conditions. Hence, inspection of each and every filled and sealed product unit before the unit is taken into labeling or packaging is mandatory.1

  • 1 a b United States Pharmacopeia. USP Chapter <790>: Visible Particulates in Injections.

Using the Attribute Agreement Analysis Method

The visual inspection process is the final step in this scenario to ensure finished products in the marketplace are particle free.USP Chapter <1790> includes a critical requirement to qualify the visual inspection system and demonstrate the consistency of inspection processes throughout the product life cycle.2

Visual Inspection Process Methods

In the visual inspection process, both manual and automated inspection methods are fundamentally based on the optical characteristics of filled units. Irrespective of the method of inspection, the visual inspection process is always probabilistic rather than definitive. For this reason, the simple pass-fail criterion in evaluation of visual inspection process has drawbacks.

Knapp and Budd have provided a statistically justified method to evaluate visual inspection processes,3  but this method also has limitations. Specifically, the Knapp method is useful for determining rejection zone efficiency (RZE), reject/accept/gray (RAG), and so on, but it falls short for detailed multidimensional analysis.

The attribute agreement analysis method (or 3A method) of evaluation offers a statistically based, practical technique with comprehensive analytical capability. This method not only identifies the efficiency of visual inspectors or the overall visual inspection process, but also evaluates the misclassification rates (unit-wise and inspector-wise) and the estimated accuracy range of inspectors with a 95% confidence interval (CI). The 95% CI is chosen because it is the most commonly used interval with a significant level of confidence.

Using the 3A method, one can identify the borderline defective units (or gray-zone units). These analyses help pinpoint the need for retraining or improvement opportunities in the visual inspection process. Table 1 summarizes the differences between the pass-fail, Knapp, and 3A methods.


Table 1: Comparison of 3A method with other evaluation methods.
  Pass-Fail Knapp 3A
Applicability Largely for manual inspection; limited applicability to automated inspection Applicable to automated inspection; can be used for manual inspection Applicable to manual inspection; can be extended to automated inspection
Number of inspection trials Not defined or not fixed Relatively large (i.e., generally 10 inspection trials per inspector) Relatively small (i.e., generally 3 inspection
trials per inspector)
Statistical validity of evaluation approach Not valid Statistically valid Statistically valid
Analysis of test results Not standardized; depends on evaluators or organizations Standardized approach, one- or two-dimensional (e.g., RZE and RAG) Standardized approach, multidimensional
Causal analysis of misclassification (good rated bad or vice versa) Not possible; misclassification only
attributed to inspector error
Not possible; misclassification only
attributed to inspector error (or inspection machine error)
Possible to attribute error to either
inspectors or inspected units (vials)
Extrapolation of test results Not possible Not possible Accuracy of inspectors can be manipulated with 95% CI to estimate possible accuracy range in future inspections
Extent of data analysis Low to moderate Moderate Comprehensive
Identification of improvement needs in inspection process Limited to inspector training Capable of identifying need for inspectors’ training or inspection machine optimization Facilitates designing of need-specific training for inspectors and identification of improvement opportunities in the inspection system

Applying the 3A Method

The calculations associated with the 3A method are straightforward. They can be done manually, although the use of commercially available statistical software simplifies the tasks. Also, the graphical representations generated by software or a spreadsheet are useful in interpreting data.

Scenario

Let’s consider a scenario in which 100 known vials are to be inspected by three visual inspectors (in the evaluation study). These 100 vials include 20 defective vials (of known defects) and 80 defect-free vials. The defective (bad) vials contain both particulate defects (e.g., fragments of glass, metal, elastomeric materials) and nonparticulate defects (e.g., cracks, inappropriate seals). Defective vials are selected from production rejects that have been removed from product lots. Alternatively, the re-creation of equivalent defects in a controlled laboratory is also acceptable.2 The defect-free (good) vials are also selected from actual product lots. All 100 test vials are standardized by expert inspectors prior to the start of evaluation. The standard vials are assigned identification numbers, and information about their conditions (categorization as good or bad vials) is concealed from the inspectors under evaluation. In this evaluation study, three visual inspection trials were conducted independently on three different days. The results are shown in Table 2.


  • 2 a b United States Pharmacopeia. Chapter <1790>: Visual Inspection of Injections.
  • 3Knapp, J. Z., and G. W. Budd. “Excerpts Taken from the PDA 2005 Annual Conference Paper Presented by Julius Z. Knapp and Gerald W. Budd: Part III: Reject Zone Efficiency and the Sampling Inspection Implementation of Standard Procedures for Visual Inspection: NIST Traceable Automated Contaminating Particle Measurements, Using the NIST2-ParticleVision™ System.” Phoenix Imaging Ltd. website. http://www.mib-lights.com/wp-content/uploads/2013/10/Part-III-Reject-Zone-Efficiency-and-the-Sampling-Inspection-by-Knapp-and-Budd.pdf
Table 2: Partial record of visual inspection trials showing data for 10 out of total 100 vials.*

Calculations for Analyzing Inspection Results

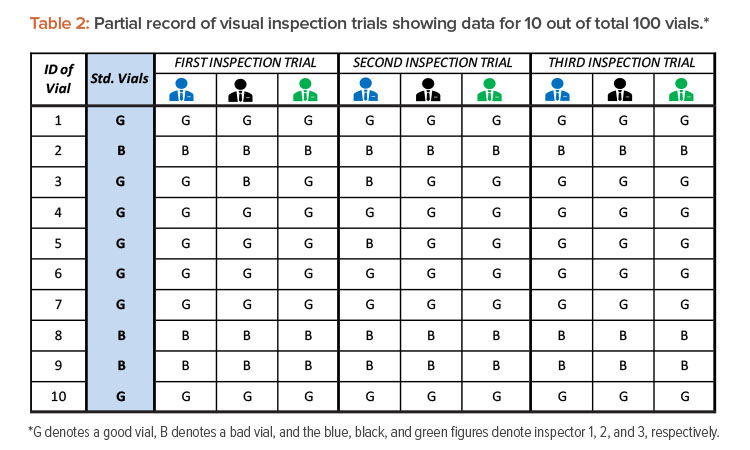
After completing three visual inspection trials by three inspectors and recording observations in Table 2, the following data are used to begin outcomes analysis:

  • Total number of inspections = Total number of vials inspected (100) × Number of inspection trials (3) × Number of inspectors (3) = 100 × 3 × 3 = 900 total inspections
  • Total number of good vials inspected = Number of good vials (80) × Number of inspection trials (3) × Number of inspectors (3) = 80 × 3 × 3 = 720 good vials inspected
  • Total number of bad vials inspected = Number of bad vials (20) × Number of inspection trials (180) × Number of inspectors (30) = 20 × 3 × 3 = 180 bad vials inspected

From those data, several calculations are run. These calculations and the results are shown in Table 3.


Table 3: Equations, values, and results for calculations.
Calculation Equation Values %
Overall accuracy (\(\frac{Total\; number\; of \;inspections\; that\; match\; the\; standards}{Total \;number\; of\; inspections}\)) x 100 (\(\frac{862}{900}\)) x 100 95.8
Overall error rate (\(\frac{Total\; number\; of\; inspections \;that \;do \;not\; match\; the\; standards}{Total\; number \;of\; inspections}\)) x 100 (\(\frac{38}{900}\)) x 100 4.2
Good units rated as bad (\(\frac{Total\; number\; of\; good\; units\; rated\; as \;bad}{Total\; number\; of\; good\; units\; inspected}\)) x 100 (\(\frac{33}{720}\)) x 100 4.6
Bad units rated as good (\(\frac{Total \;number\; of\; bad\; units\; rated\; as\; good}{Total \;number\; of\; bad\; units\; inspected}\)) x 100 (\(\frac{5}{180}\)) x 100 2.8
Inspector accuracy rate (\(\frac{Number \;of\; correct\; matches\; by \;the\; inspector}{Number\; of\; inspections \;done \;by\; the\; inspector}\)) x 100    
Example for inspector 1 (\(\frac{280}{300}\)) x 100 93.3
Unit-specific error rate (\(\frac{Number\; of \;incorrent\; matches\; on\; the\; specific\; unit}{Number \;of\; inspections\; done\; on\; the\; specifc\; unit}\)) x 100    
Example for vial 11 (\(\frac{8}{9}\)) x 100 88.9
Good units rated as bad by inspector (\(\frac{Number\; of\; good\; units\; rated\; as\; bad \;by\; the\; inspector}{Number \;of \;good\; units \;inspected\; by \;the \;inspector}\)) x 100    
Example for inspector 1 (\(\frac{17}{240}\)) x 100 7.1

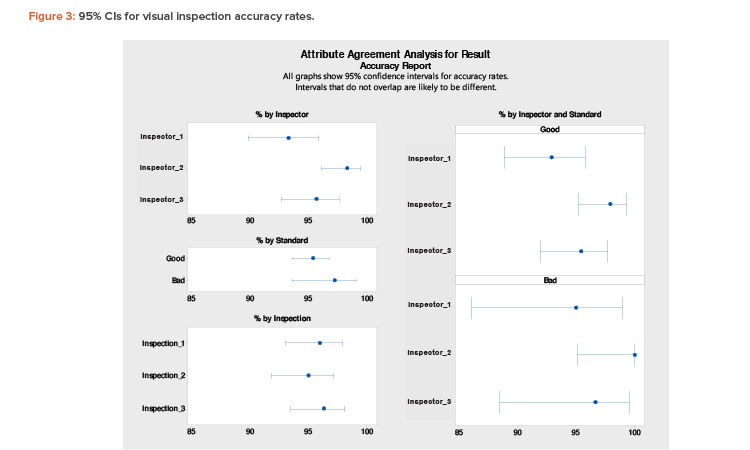
Using these calculations, we can then determine upper and lower bound CIs for inspector accuracy rates on good units with a 95% CI (α = 0.05):4

Lower bound value = $$\frac{1}{1+\frac{n-x+1}{x}F_{2(x+1),2x,\alpha/2}}$$

Upper bound value =$$\frac{\frac{x+1}{n-x}F_{2(x+1),2x,\alpha/2}}{1+\frac{x+1}{n-x}F_{2(x+1),2x,\alpha/2}}$$

where

x = number of correct matches with good units by the inspector

n = total number of good units inspected by the inspector

Fv1,v2,α= F distribution table value with v1 and v2 degrees of freedom at alpha (95%) level of confidence

Example for inspector 1:

Lower bound value = $$\left(\frac{1}{1+\frac{240-223+1}{223}F_{2(240-223+1),(2x223),0.05/2}}\right) x 100$$

= 88.9%

Upper bound value =$$\left(\frac{\frac{223+1}{240-223}F_{2(223+1),2(240-223),0.05/2}}{1+\frac{223+1}{240-223}F_{2(223+1),2(240-223),0.05/2}}\right)x 100$$

= 95.8%

Note: It is best to use statistical software to calculate the exact CI because the formulas are complex. For manual calculation, a relatively simple normal approximation method can be used. The formulas are as follows:

formula $$\left(p\pm Z_{1-(\alpha/2}\sqrt{\frac{p(1-p)}{n}}\right)x 100$$

where

P=\(\frac{Number\; of \;correct\; matches \;with \;good \;units \;by \;the \;inspector}{Total\; number\; of \;good\; units\; inspected \;by \;the\; inspector}\)

Z1-(α/2)=1.96 for 95% CI

n = total number of good units inspected by the inspector

Graphical Tools to Interpret Trial Data

The data obtained from inspection trials can be graphically illustrated by using a spreadsheet application or commercially available statistical software.

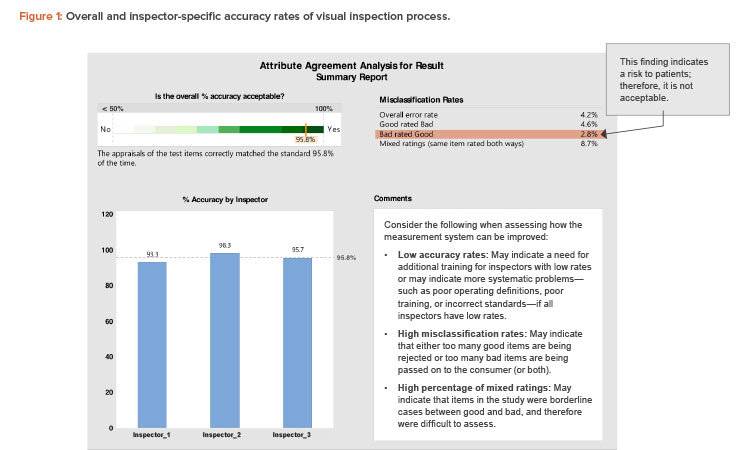
The first report (Figure 1) shows the overall accuracy of the visual inspection process (95.8%). The overall process complies with the minimum acceptance for accuracy of 95% (a justifiable limit).

Figure 1 also compares the individual accuracy of the three inspectors. Inspector 1 had an accuracy rate of 93.3%, which is below the acceptance accuracy limit. Hence, inspector 1 needs to be retrained.

A point of concern related to the “misclassification rate” in Figure 1 is the presence of defective units rated as good units (bad rated good). Units misclassified as good may cause health risks to patients and are therefore unacceptable from the GMP perspective. The misclassifications might have been due to a specific inspector’s errors, or they might be borderline cases for which it is difficult for any inspector to differentiate between good and bad units.

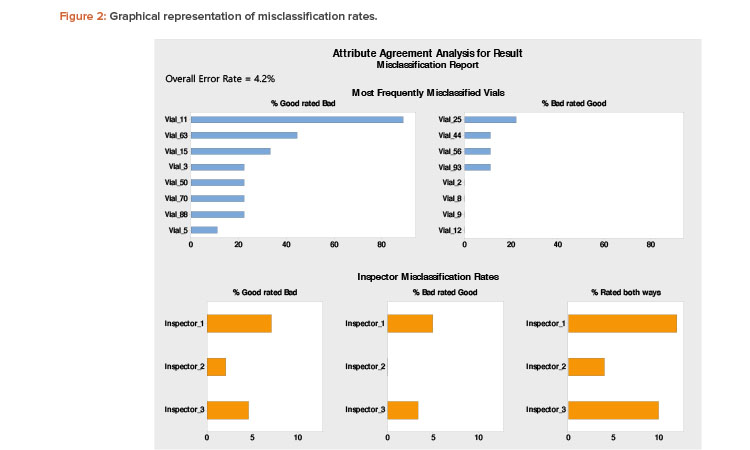
Figure 2 can be useful to interpret misclassification rates. A low rate of accuracy overall and across all inspectors indicates the need to improve the effectiveness of visual inspection procedures, arrangements, or training.


  • 4Morisette, J. T., and S. Khorram. “Exact Binomial Confidence Interval for Proportions.” Photogrammetric Engineering & Remote Sensing 64, no. 4 (April 1998): 281–283. https://pdfs.semanticscholar.org/8622/a48e1c0b38ceaa294c6dd2610714281dfd95.pdf
Figure 1: Overall and inspector-specifi c accuracy rates of visual inspection process.

Figure 2: Graphical representation of misclassifi cation rates.

Figure 3: 95% CIs for visual inspection accuracy rates.

The top section of Figure 2 shows the unit-specific (vial-specific) misclassification rates. It is evident that vial 11 has been misclassified 88.9% times across all inspectors. This is indicative of a borderline case. The evaluators (expert inspectors) should reinspect the borderline vial to identify the discrepancy and preferably replace it with a prominent good vial in future inspection trials. The misclassification rates of other vials are less than 50% and can be attributed to errors by the inspectors. The bottom portion of Figure 2 shows that inspectors 1 and 3 have misclassified bad vials as good (which is a patient safety risk). Based on this finding, those two inspectors require further training regarding proper classification.

The attribute agreement analysis method (or 3A method) of evaluation offers a statistically based, practical technique with comprehensive analytical capability.

Finally, Figure 3 shows results with 95% CIs. In this figure, the “% by Inspector and Standard” section is the main focus. An expected accuracy limit of not less than (NLT) 90% is reasonable. (A higher acceptance limit, such as NLT 95%, can be assigned for requalification of more experienced inspectors.)

An expected accuracy limit of NLT 90% means there is a 95% confidence level that the estimated “% Accuracy” of an inspector will not be less than 90% in any future inspection. However, the acceptance criterion (point estimation) for “% Accuracy” of an inspector is NLT 95% in this evaluation meth-od.

Figure 3 shows lower bound interval values of less than 90% for inspectors 1 and 3, especially for distinguishing defective units (bad vials). Therefore, to improve the estimated range, both inspectors should undergo more extensive training to improve consistency.

Conclusion

The 3A method provides an effective way to evaluate the accuracy of a visual inspection system for parenteral products. It can be used in initial and periodic qualification of visual inspectors. Because the core principle of visual inspection in parenteral products is the same for both manual and automated processes, this method can be extended to automated or semiautomated visual inspection systems as well. Furthermore, the multidimensional analysis of inspection trials provides an in-depth understanding of the visual inspection process and inspectors’ capabilities. The interpretation of 3A method test results helps capture weaknesses in a visual inspection program and in turn supports formulating improvement initiatives.