Continuous Oral Solid Dosage in the Field - A Status Update

Although it includes some background material, this article is based predominantly on a series of interviews with SMEs at Eli Lilly, Janssen, Hovione, C-SOPS, and Patheon from October to December 2017. The comments and observations that follow are theirs.
For close to a decade, we’ve heard much about the promises of continuous manufacturing (CM) for oral solid dosage (OSD). So now that four OSD drugs are being manufactured by CM in the United States (at Vertex, Janssen, and Lilly), with at least five more in the approval pipeline, it’s time to take stock: Has CM delivered on its promises?
The Promises
- Simpler, faster, and cheaper development: Because the equipment is small, development should occur on full-sized equipment, with no scale-up required.
- Lower facility capital and operating costs: Because CM processes a batch quantity over time, equipment should have a smaller footprint. This would reduce costs for the entire facility.
- Better efficiencies: Since material is continuously in process, there should be no “work in progress” material staged and waiting to proceed to the next unit operation.
- Improved quality and higher yields: The extensive characterization required to establish a continuous process, as well as the monitoring technology frequently used in conjunction with CM, should enable a more consistent quality outcome, eliminate the need for product testing, and enable real-time release of the final drug form.1
This article will examine each promise in turn, evaluating how well current continuous OSD processes stack up to the ideal.
Simpler, Faster, Cheaper
Continuous processing equipment is small, because final production volume depends on how long it runs, not how much it can hold. A 25-kilogram-per-hour (kg/hr) continuous line can theoretically complete a 600-kg batch in 24 hours. But a fluid bed designed to process 25 kg over the course of an hour is significantly smaller—small enough to fit into a laboratory. Thus, the development lab can perform tests on equipment identical to that used in the manufacturing space, and the same equipment can be used for laboratory characterization and commercial manufacturing. As a result, scale-up can be reduced or eliminated.
This significantly reduces API consumption. Even if the R&D and “pilot-scale” development steps for batch and continuous require equivalent quantities of API, the bulk of powder used in development is consumed during scale-up. Eric Jayjock2 , Director of Continuous Manufacturing at Patheon, estimates that scaling-up to a 300-kg batch will require 2,250 kg of material, while scaling up to a 600-kg batch will require an additional 5,580 kg of material. This powder is discarded after use and is not profitable in any way.3 If the API is 10% of the formulation and worth $5,000/kg, then the total savings derived from avoiding scale-up are $2,925,000. For a new product, APIs may cost four times as much and can be difficult to obtain if extensive testing is required. Table A is based on Jayjock’s cost estimate for scale-up.
| Estimated drug formulation used, kg |
Cumulative drug formulation used, kg |
API as 10% of formulation, kg |
Scale-up cost, API at $5,000/kg |
Scale-up cost, API at $10,000/kg |
|
|---|---|---|---|---|---|
| R&D | 90 | 90 | 9 | $45,000 | $90,000 |
| Pilot | 360 | 450 | 45 | $225,000 | $450,000 |
| Scale-up to 300 kg | 1,800 | 2,250 | 225 | $1,125,000 | $2,250,000 |
| Scale-up to 600 kg | 3,600 | 5,850 | 585 | $2,925,000 | $5,850,000 |
CM development is unlikely to require equivalent quantities of API. Using statistical design of experiment, scientists can test the interactions of multiple parameters rapidly and successively on a CM line. The line is started and held until it reaches steady-state operation for a given set of conditions, then a sample is taken. A parameter or set of parameters is then changed through the control system, steady-state conditions are again reached, and another sample is taken. This can be repeated until all testing is completed. Fernando J. Muzzio, Director of the Rutgers University Center for Structured Organic Particulate Systems (C-SOPS), estimates that it takes between 10 and 45 minutes to test a single data point, and characterization for most products requires between 10 and 40 such data points. This means it can take between a day and a week to complete a full-scale system characterization for a new product.
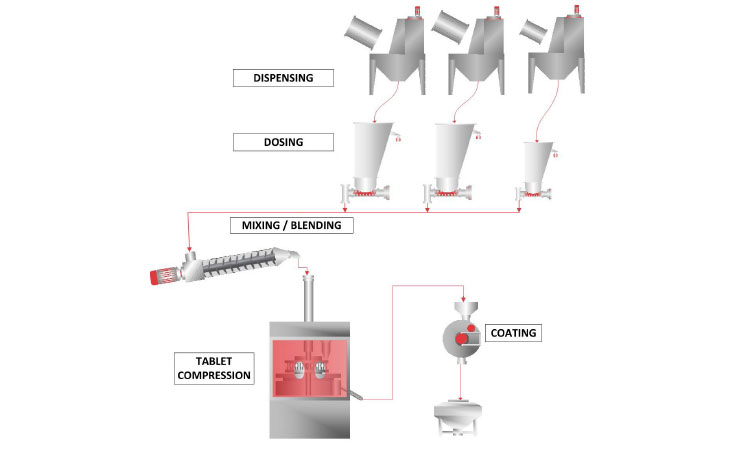
The number of unit operations necessary to manufacture a product using CM may be less than what is required for a batch process. Granulation processes are frequently developed to create an intermediate product that is robust enough to allow processing through the often-extended batch manufacturing process. Since it takes minutes rather than days to process powder through a CM line, there is not the same generation of intermediate products. David Pappa, Technical Services/Manufacturing Science Director at Lilly, stated that one of the benefits of turning to continuous manufacturing was that it provided additional robustness in allowing utilization of direct compression where that would have been difficult to achieve in a batch process (Figure 1). Lilly’s CM line only does direct compression, and if they come across a drug formulation that cannot be done via direct compression on a CM line, their current strategy is to manufacture it in a traditional batch mode. This is one way CM could potentially reduce the quantity and footprint of processing equipment and associated spatial requirements even further.
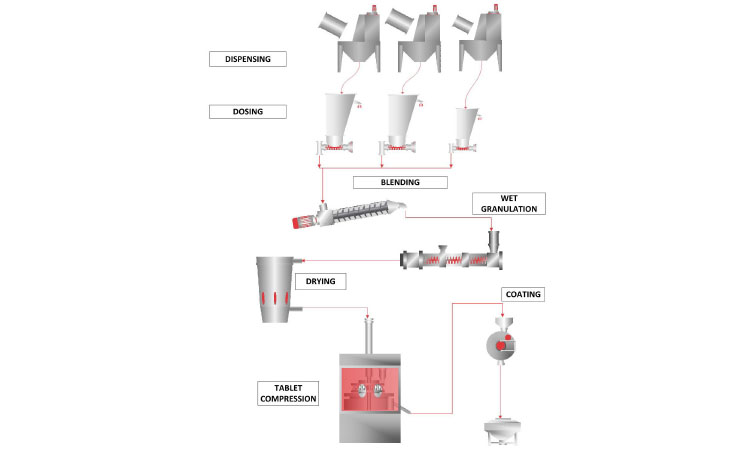
Despite its smaller footprint and potentially greater efficiency, the up-front cost of purchasing a CM system is significant. Equipment for a full wet-granulation line, including material handling, can run from $12 million to $16 million (Figure 2). A few vendors have benchscale continuous wet-granulation lines (0.5–1.5 kg/hr) designed to simulate full-scale equipment, which they say can be installed in the corner of a laboratory for as little as one-tenth the cost of a full-scale system. Scale-up for these systems is either mathematical or not required. Even if full testing is desired, however, the total volume of powder consumed in the scale-up will be less than scaling up to a batch process or testing on full-sized CM equipment from the start.
- 1DiProspero, David. “Continuous OSD Manufacturing.” CRB Blog. www.crbusa.com/continuous-osd-manufacturing
- 2Jayjock, Eric. “Patheon’s Eric Jayjock Discusses Continuous Manufacturing.” Presented at Interphex, 26–28 April 2016, New York, New York. www.youtube.com/watch?v=hNRYVT5M-jM&t
- 3Nowak, Sharon. “Improving Feeder Performance in Continuous Pharmaceutical Operations.” Pharmaceutical Technology 40, Issue 10 (October 2016): 68–73. http://www.pharmtech.com/improving-feeder-performance-continuous-pharmaceutical-operations
If the API to be used is so valuable that even this reduced consumption seems excessive, there is another option: C-SOPS has spent the last 10 years characterizing powders commonly used in OSD manufacturing. Muzzio says they can use this database of powder characteristics to suggest an analog—a powder that will behave similarly, but cost significantly less. The analog could then replace an expensive API during repetitive experimentation. This substitution is not limited to CM process development, but the benefit became apparent through the C-SOPS efforts to advance CM technology.
With all this considered, the consensus is that CM has delivered on its promise of faster, cheaper development. That said, there is an up-front cost to adopting any new technology—especially nascent technology. The entire engineering team will have to master and understand new equipment and monitoring systems, and the learning curve can be steep. Additionally, because initial equipment offerings were developed by vendors without significant user input, adopting new technology necessarily means being the beta tester for untried systems, with associated costs in time and money.
The result is both an exciting new field to explore, and a field of land mines to defuse. One particularly knotty challenge is the loss-in-weight feeders used to meter powders into the blend in precise ratios. The feeders must accurately measure the amount of powder being dispensed even while they are being refilled from bulk dispensers, and this measurement must be based on data from sensitive load cells in a manufacturing environment prone to vibration and noise.4 This challenge has kept laboratories across the industry busy researching the ideal frequency for re¬filling the hoppers, the best way to isolate the feeders from environmental disturbances, and how the system should adjust if one feeder changes its feed rate.
While some information has been exchanged between various interested parties, all manufacturers and vendors ultimately work independently on the same problems. Thus, David Pappa from Lilly describes the ratio-control loop on their feeders, which uses the API feeder speed to control the speed of all excipient feeders, thus ensuring proper content ratios. The Lilly team considers the design fundamental to the success of their line, but they are currently the only manufacturer using it. This type of extensive engineering work by vendors, manufacturers, and academic partners is not typically included in the estimated cost of development for a CM line.
An additional consideration is process analytic technology (PAT), which allows in-process monitoring with the goal of ensuring final product quality. PAT is a discipline of its own, and one with which most OSD manufacturers have little or no experience. Selecting, testing, and creating models for PAT, moreover, takes time that has not traditionally been part of process development. This means bringing workers with new expertise into the development lab.
As newer generations of CM equipment evolve, and as manufacturers develop their own expertise, these costs may drop to levels that correspond to that of batch development. But for anyone considering jumping into CM in the next 5 to 10 years, this up-front investment is a significant consideration.
| Unit operation | Hours |
|---|---|
| Weighing | 3 |
| Blending | 2 |
| Granulation | 15 |
| Milling | 2 |
| Compression | 30 |
| QA hold (after each operation) | 2 |
- 4Wilburn, Kristopher Ray. “Business Case for Continuous Manufacturing of Pharmaceuticals.” MIT Sloan School of Management Thesis, 7 May 2010. https://pdfs.semanticscholar.org/1825/34c9d3461b-043999bc205505252174166010.pdf?_ga=2.12692599.1785536733.1530128597-2113575302.1530128597
Lower Facility Capital and Operating Costs
Because CM equipment is smaller, the facility footprint should also be correspondingly smaller, since an entire room is no longer needed per unit operation and multistory gravity-fed granulation trains are no longer necessary. Smaller rooms also mean lower air-conditioning requirements and related HVAC savings.
A 2010 MIT paper that estimated facility cost-savings for CM vs. batch operations found a 31% improvement in utilities spending, 56% reduction in material handling, 50% reduction in direct labor, and 72% reduction in QA staffing (indirect labor).5
Only one company, Janssen, has comparative batch and CM costs for the same product, as they performed a technology transfer from batch to CM for Prezista. While they have not released the actual figures, Lawrence de Belder, CM program manager in the Janssen supply chain, is an unflagging and enthusiastic promoter of the technology. In a 2016 presentation he demonstrated a sample calculation using fictive numbers that others could utilize to estimate their savings by using CM technology.6
Floor Plans
Batch size depends on run time in a CM process, but on equipment size in a batch process. This makes it difficult to do an apples-to-apples comparison. A floor plan analysis of three active CM facilities found that between 2,500 and 4,100 square feet (sq ft) were dedicated solely to direct powder-processing equipment space. (Only rooms that housed processing equipment were included in the analysis, since discretionary areas such as washrooms, staging area, corridors, and storage accounted for as much as 70% of the facility.)
A hypothetical batch facility was then configured to match a 20-kg/hr continuous-line throughput using the unit-operation durations shown in Table B. The batch facility, which was capable of four 600-kg batches in one week, would approximately match the CM OSD line production capabilities of the studied facilities over the same time period.
Several OSD batch facility floor plans were also analyzed to determine the square footage necessary to house these operations. The analysis determined that around 9,000 sq ft would be required for direct powder contact unit operations (see Table C). CM facilities would need only about one-third the processing space to be conditioned and cleaned—a significant reduction in HVAC overhead (Table D).
| Parallel 600-kg batch facility | Sq ft |
|---|---|
| Weigh/disperse | 1,116 |
| Blending | 1,722 |
| High-shear granulation | 1,370 |
| Fluid-bed drying | 1,662 |
| Compression | 1,818 |
| Coating | 1,580 |
| Total processing space | 9,268 |
Operators
QA release is required after each batch unit operation, but is required only after process completion for a continuous process. This essentially eliminates in-process testing labor. It is not clear, however, how much direct labor is actually saved by switching to a CM process. While in theory CM staffing requirements should drop significantly because all the equipment is in two or three rooms, real-world numbers tell a slightly different story.
The average number of operators for a dry-granulation continuous process hovers between four and eight, depending on the process and employer. The average for a dry-granulation batch process, assuming that each unit has two full-time operators and all units are operating simultaneously, is six to eight.
Moreover, while daily batch process operations can be performed by any skilled operator, continuous equipment is new and complex enough that frequent support may be required from the PAT lab— an indirect labor expense that is often overlooked. This number may be expected to decrease as organizational expertise increases and systems become better known, or it may go down for another reason, says Savitha Panikar, a PAT scientist for Hovione. Some companies, she reports, have been pushing to minimize the use of spectral probes in CM line monitoring to minimize the complexity they add to regulatory filings.
Some argue that a good control strategy can ensure product quality without in-line PAT measurements. In response to a June 2017 FDA docket on continuous OSD manufacturing,7 GSK noted that “PAT applications used during development … may not always be required [during commercial manufacturing].”8 In their comments on the docket Merck echoed this reluctance to presume the use of PAT at the commercial level, stating, “Different levels of control, such as PAT usage, sampling frequency, and RTD models may be appropriate for different products and processes.”9 If this presages a move toward alternative control strategies, the costly involvement of PhDs in the daily operation of continuous manufacturing lines would be reduced.
| 20-kg/hr continuous OSD facility | Sq ft |
|---|---|
| First level processing space | 1,037 |
| Mezzanine / midlevel processing space | 911 |
| Third level processing space | 1,084 |
| Total processing space | 2,436 |
Improved Efficiencies
Pharmaceutical batch production equipment may have a capacity utilization as low as 30%, while in other industries using CM utilization can be as high as 90%.10 But while this conjures images of manufacturing lines churning out identical widgets for weeks, months, or even years on end, the reality in pharmaceutical manufacturing is not as heartwarming. This stems from a few factors.
The first reason efficiency remains low is product demand. While blockbuster drugs and OTCs could keep a CM line running 24/7, many drugs currently in the pipeline have a lower demand projection. Indeed, while talks about CM are going on at one end of the ISPE Annual Meeting, there are concurrent seminars on personalized medicine and 3D printing at the other. As companies seek profit in the long tail of medicine, the number of tablets required for the subject population drops, and the residence time required on a CM line drops as well. As a result, CM lines in OSD pharma are more likely to run multiple similarly formulated products for shorter periods, requiring a changeover in between runs more like a packaging line than a food production line.
Second, FDA regulation adds an additional level of complexity that further reduces efficiency. Pharmaceutical manufacturing processes must be validated, and each validation will cover a single batch of a given size. CM batch sizes must therefore be determined before the production run begins. If validated for a three-day batch, the line must stop producing at the three-day mark, even if it’s at steady state and showing every sign of hitting quality targets.
Eric Jayjock has proposed that facilities could campaign batches without stopping in between. In these cases, the original FDA product-approval filing would include a protocol to describe how these longer campaign times would be validated. The protocol would be product-specific, as each one would have a unique risk profile. By doing this, longer (and more efficient) run times could be validated.
At the moment, however, no one is actually doing this and most express discomfort with the idea, often citing microbial concerns. Lilly has validated to the size of their batch coater, and they do not anticipate extending batch sizes. Janssen has a run time of 32 hours for Prezista, which must be followed by four shifts of cleaning, disassembly, and turnover. Vertex also runs for a few days and then spends as much or more time cleaning and reassembling.
And therein lies a third complication: Complex equipment with extensive changeover requirements means efficiencies still float below 50%. Vendors created CM equipment in anticipation of a new market, but manufacturers’ limited experience has prevented them from articulating their needs with any kind of specificity. Now, with greater knowledge and understanding, reduced changeover requirements are on nearly all industry wish lists.
After shutdown, equipment must be disassembled, removed to a washroom, cleaned out of place, and reassembled. One company cleans 2,700 individual parts between batches. This makes cleaning validations both difficult and costly (and yet another up-front cost not typically included in cost-of-CM estimates). Modular parts can take some of the pain out of this, but simpler assemblies or even equipment that can be cleaned in place would make a more significant dent in the problem. Janssen has added WIP and CIP capability to some of the equipment on their later lines, and other companies are seeking to follow suit.
In contrast, batch equipment for a unit operation can be cleaned and changed over while the next unit operation proceeds to completion. In an efficient facility, the first unit operation can be cleaned, changed over, and running a second product while the tablet press is still finishing the first product. On a continuous line, all unit operations are closely connected, and there is negligible time difference between shutting down the first unit operation and shutting down the last. The entire line must be down for the duration of the cleaning process.
Right now, the requirement to spend as much time cleaning as running prevents continuous OSD from achieving the high efficiencies that CM promises. With Patheon coming online in the near future, it will be interesting to see if they bring a new paradigm to the issue of run time.
Higher Quality and Better Yield
Running a continuous process requires extensive characterization in the lab and a deep knowledge of the process that is compatible with quality by design (QbD). PAT is frequently used to track critical quality attributes and adjust critical process parameters during the process before the product can go out of spec.
The users interviewed for this article are unanimously enthusiastic on this point: Building quality management into the process has been successful. At the C-SOPS 2017 Annual Meeting, Muzzio stated that continuous processes, on average, have a quality failure rate of 1.5%, compared to 4% for batch processes.
A highly desired potential outcome of in-line monitoring is real-time release testing. If critical quality attributes can be tracked throughout the process—or tied to characteristics that can be tracked throughout the process—then the final product can be proven in-spec based on process measurements alone, without the requirement that they be tested in the lab.
There are a number of release tests that must be performed, and many can be replaced by good data from a monitored CM line. The largest exception to this is dissolution testing, which involves studying how the tablet breaks down in a warm and agitated water bath designed to simulate the human body. Because of this requirement, there is currently no product that can go straight out the door after coating. There is widespread optimism that this may soon change, however. Muzzio says they have created a dissolution model for at least one product that would allow in-line measurements to replace this release test.
While process monitoring has been a boon to the QC department, it does have a grey lining. We’ve already covered the complexities that PAT brings to daily operations, but there’s another side effect: lower yield. When all equipment is running and inputs are steady and predictable, a continuous process running in a steady or controlled state will produce product of consistent quality. During start-up—and to some extent during shutdown as well—the continuous line is not necessarily in a controlled state, and product will be diverted to waste. At least part of this lag in reaching operational conditions at start-up may be the result of near-infrared probe warmup time.8
On a CM line running for weeks or months, the startup and shutdown losses are negligible. But on a line that runs for only a few days this waste balloons as a percentage of the total product. While none of the interviewed manufacturers agreed to publish their yield numbers, none cited anything above 95%, and some processes were considerably lower. All were philosophical about it, however, saying it was too soon to measure; there was debugging to do and experience to be gained.
There are a few possible solutions to this issue. The first would be longer run times, but this hits a limit of utility with all but blockbuster products or those with long shelf lives. Installing smaller systems with lower throughput rates would waste less during start-up and shutdown, and would also lead to longer runs for comparable batches, which would address the equipment efficiency problem. The trade-o is higher equipment occupancy for the same production quantity, which could become an issue as more and more products are developed for CM. It is also difficult to meter minute quantities of API accurately using existing feeder technology.
A third potential solution would be equipment that primes rapidly and reaches a controlled state quickly. Tablet presses are already capable of this to a large extent. If feeders and blenders could be improved to the point where low powder levels don’t throw mechanisms off, yield losses could be drastically reduced.
Conclusion
Continuous OSD is young. Vertex received approval to manufacture as Orkambi in 2015, Janssen’s Prezista was approved in 2016, Eli Lilly came onboard with Verzenio in 2017, and Vertex scored again with Symdeko in 2018. It is therefore perhaps premature to deliver a report card on its successes and challenges. The companies I spoke to seemed to think so, saying it was too early to evaluate returns on the new technology.
“Better efficiency is dependent on a number of aspects which are not necessarily valid from the ¬ first batches you start running on a CM line,” said Lawrence de Belder. “It can take some time—experience, debugging, process optimization—before achieving aspirational yields.”
Indeed, in reviewing the scorecard, CM falls short when it comes to delivering a simpler, more efficient process with superior yields. Manufacturers are generally happy, on the other hand, with QbD and facility, operational, and development costs.
The good news is that these shortcomings are fixable. Improved process efficiency is an ongoing goal in any facility; in CM it’s shared by vendors and manufacturers, and supported by the FDA. The technology has arrived, and we have some brave early adopters. From here it should only advance, as users provide feedback to vendors who provide better equipment, in an ongoing loop of continuous improvement.
- 5De Belder, Lawrence. “Business Case Drivers and Deployment Strategies in the Current Landscape for Continuous Drug Product Manufacturing.” 2nd International Symposium on Continuous Manufacturing of Pharmaceuticals, Cambridge, Massachusetts, 26–27 September 2016.
- 6Shanley, Agnes. “Building a Continuous Processing Culture.” Pharmaceutical Technology 1 August 2017. http://www.pharmtech.com/building-continuous-processing-culture
- 7US Food and Drug Administration. “Submission of Proposed Recommendations for Industry on Developing Continuous Manufacturing of Solid Dosage Drug Products in Pharmaceutical Manufacturing.” Docket ID: FDA-2017-N-2697. https://www.regulations.gov/docket?D=FDA-2017-N-2697
- 8 a b US Food and Drug Administration. Comment from GlaxoSmithKline. ID: FDA-2017-N-2697-0013. In “Submission of Proposed Recommendations for Industry on Developing Continuous Manufacturing of Solid Dosage Drug Products in Pharmaceutical Manufacturing.” Docket ID: FDA-2017-N-2697. https://www.regulations.gov/document?D=FDA-2017-N-2697-0013
- 9US Food and Drug Administration. Comment from Merck & Co., Inc. ID: F FDA-2017-N-2697-0019. In “Submission of Proposed Recommendations for Industry on Developing Continuous Manufacturing of Solid Dosage Drug Products in Pharmaceutical Manufacturing.” Docket ID: FDA-2017-N-2697. https://www.regulations.gov/document?D=FDA-2017-N-2697-0019
- 10De Belder, Lawrence. “Designing a Continuous Process for Oral Solids Dose Manufacturing: A Customer’s Perspective.” ISPE 2017 Annual Meeting & Expo, 29 October–1 November 2017, San Diego, California.